Rebuilt Asset Page for Binance Pro Traders
Redesign for Clarity, Insight, and Precision

Unstructured
Asset Overview
Binance Pro is built for advanced traders, and the asset page is key to portfolio management and decision-making. However, its current experience still shows gaps that limit efficiency.
Surface-level
Asset report
Rigid
Suggestions
Data is scattered, making it hard to see the full picture at a glance.
Shows basic trends but lacks context or actionable insights.
Recommendations feel disconnected from actual trading behavior.

Guided by user perspective Powered by insight

More
Structured
Asset Page
Strategy for the Redesign
Data structured for clarity and a seamless flow, aligned with user scenarios.
More
Insightful
Asset Report
Progressive insights with clear attribution for better understanding.
More
Personalized
Suggestions
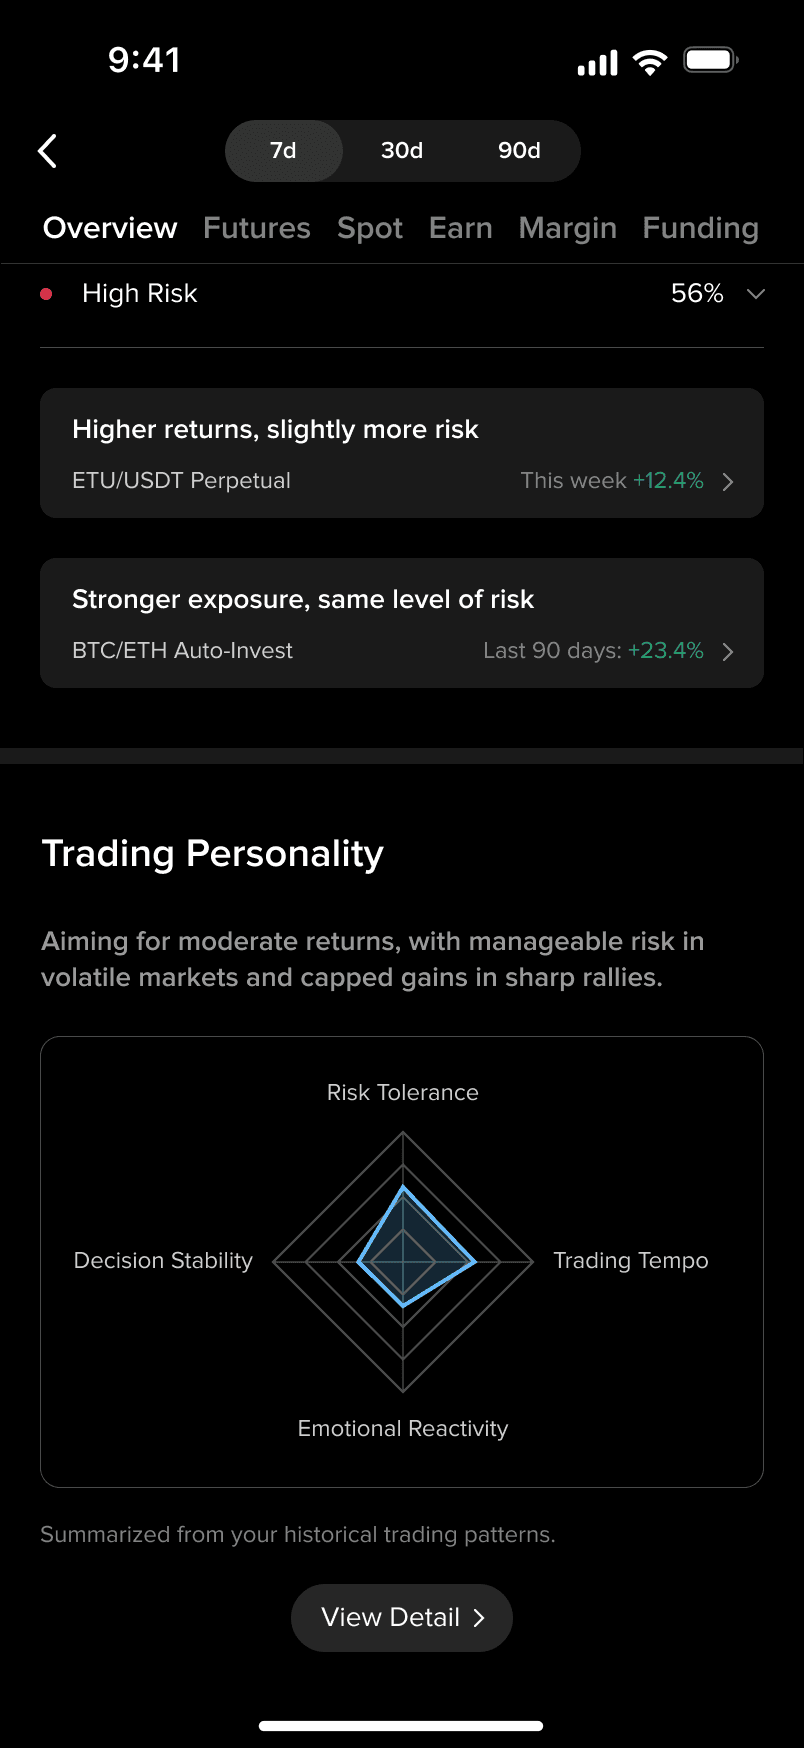
Suggestions aligned with the user’s trading personality
More
Structured
Asset Pape
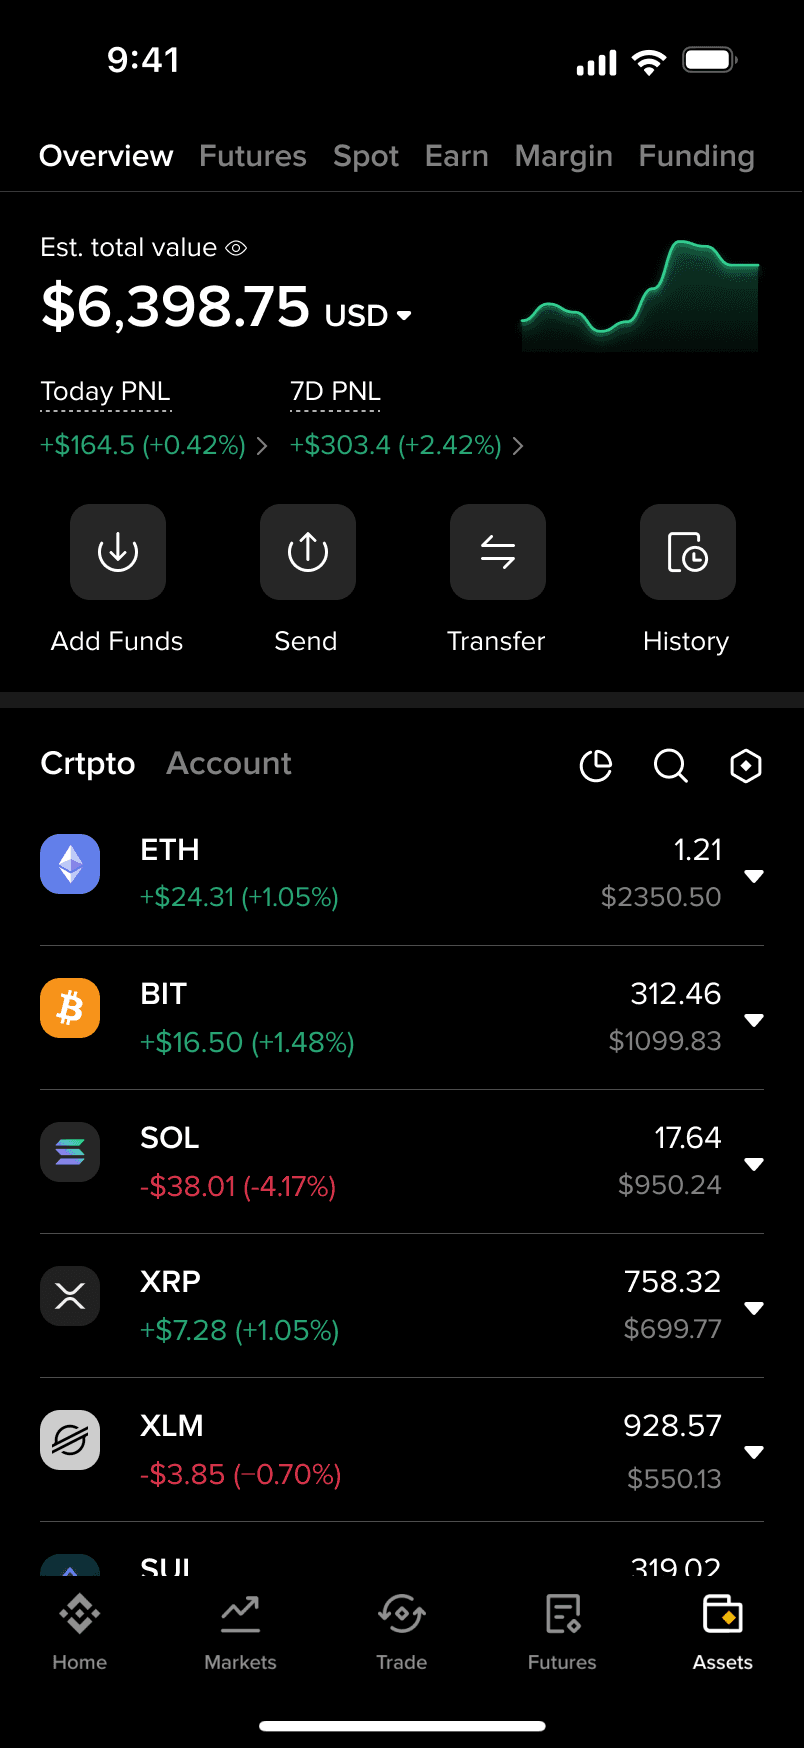
More structured layout.
Clearer at first glance.
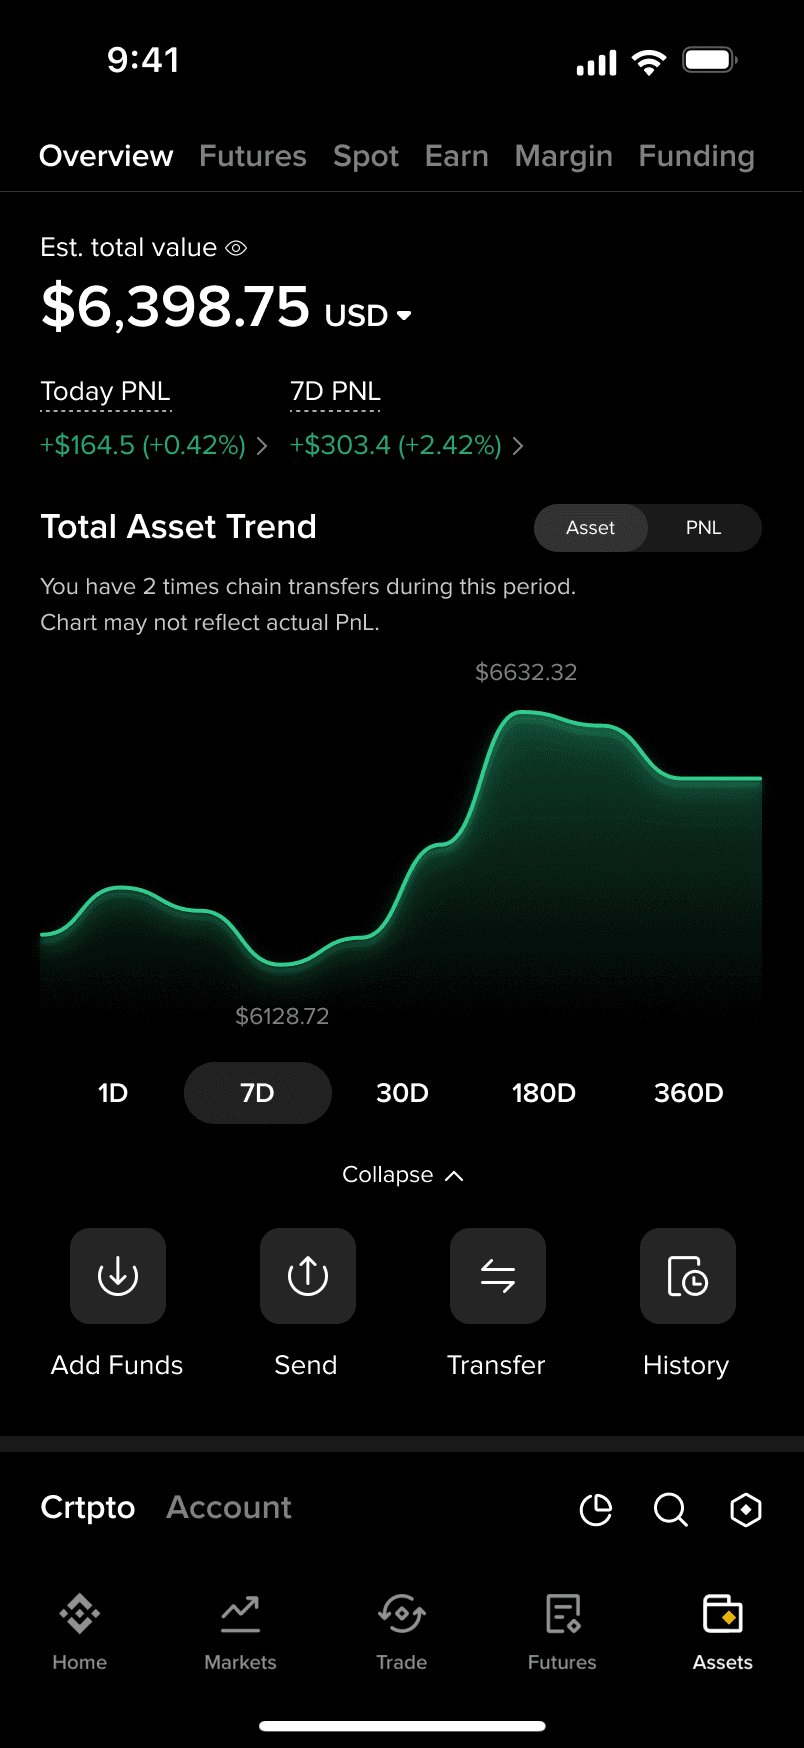
Margin separated for better clarity
Recognizing different risk levels, margin is now placed in its own category, making positioning and value tracking more transparent.
Before
After
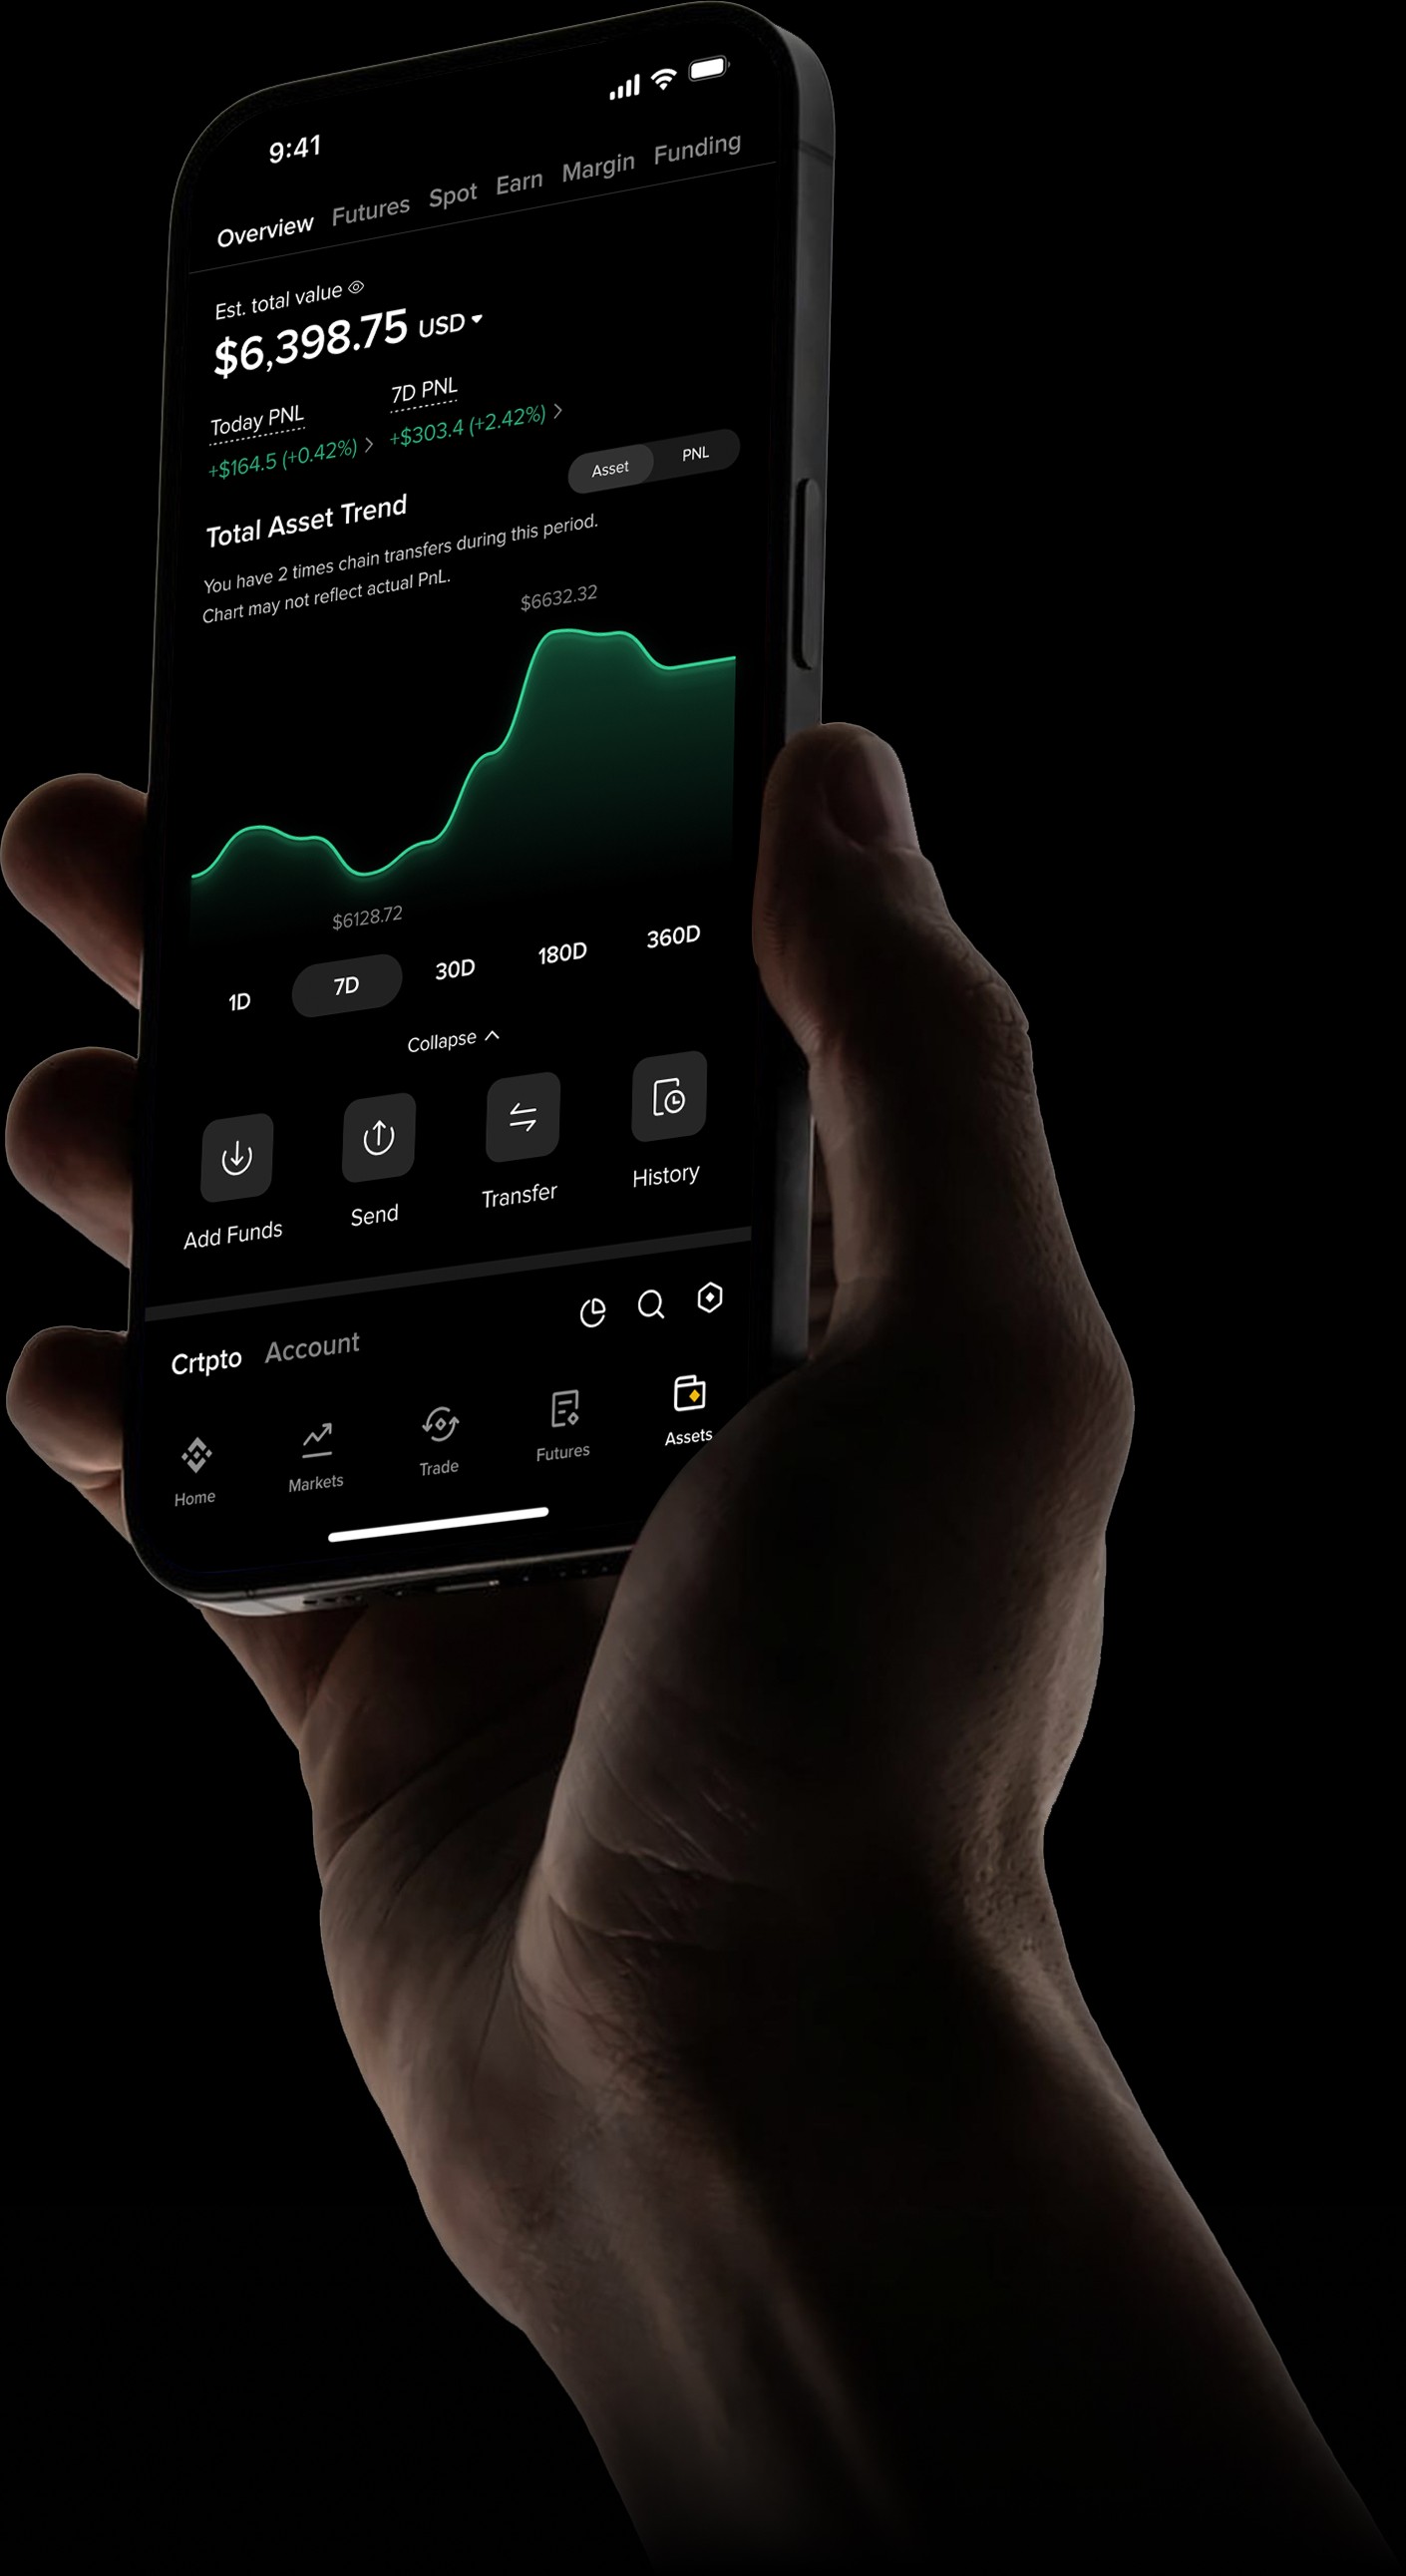
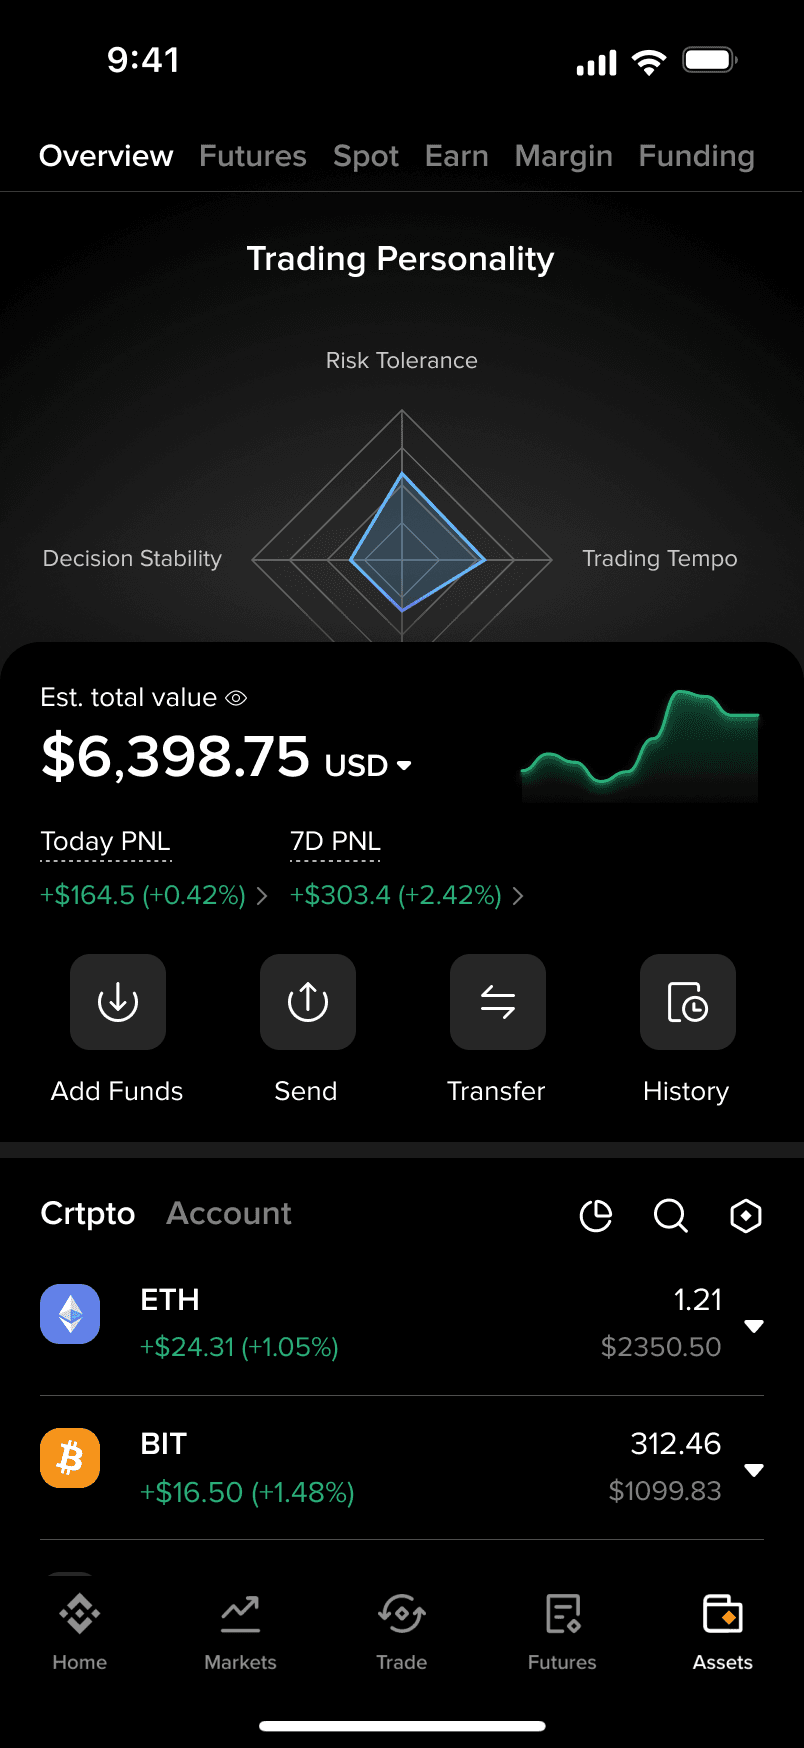
7-day PNL and trends, now at a glance
With the new chart and profit display, recent asset changes are easier to grasp without digging deeper.

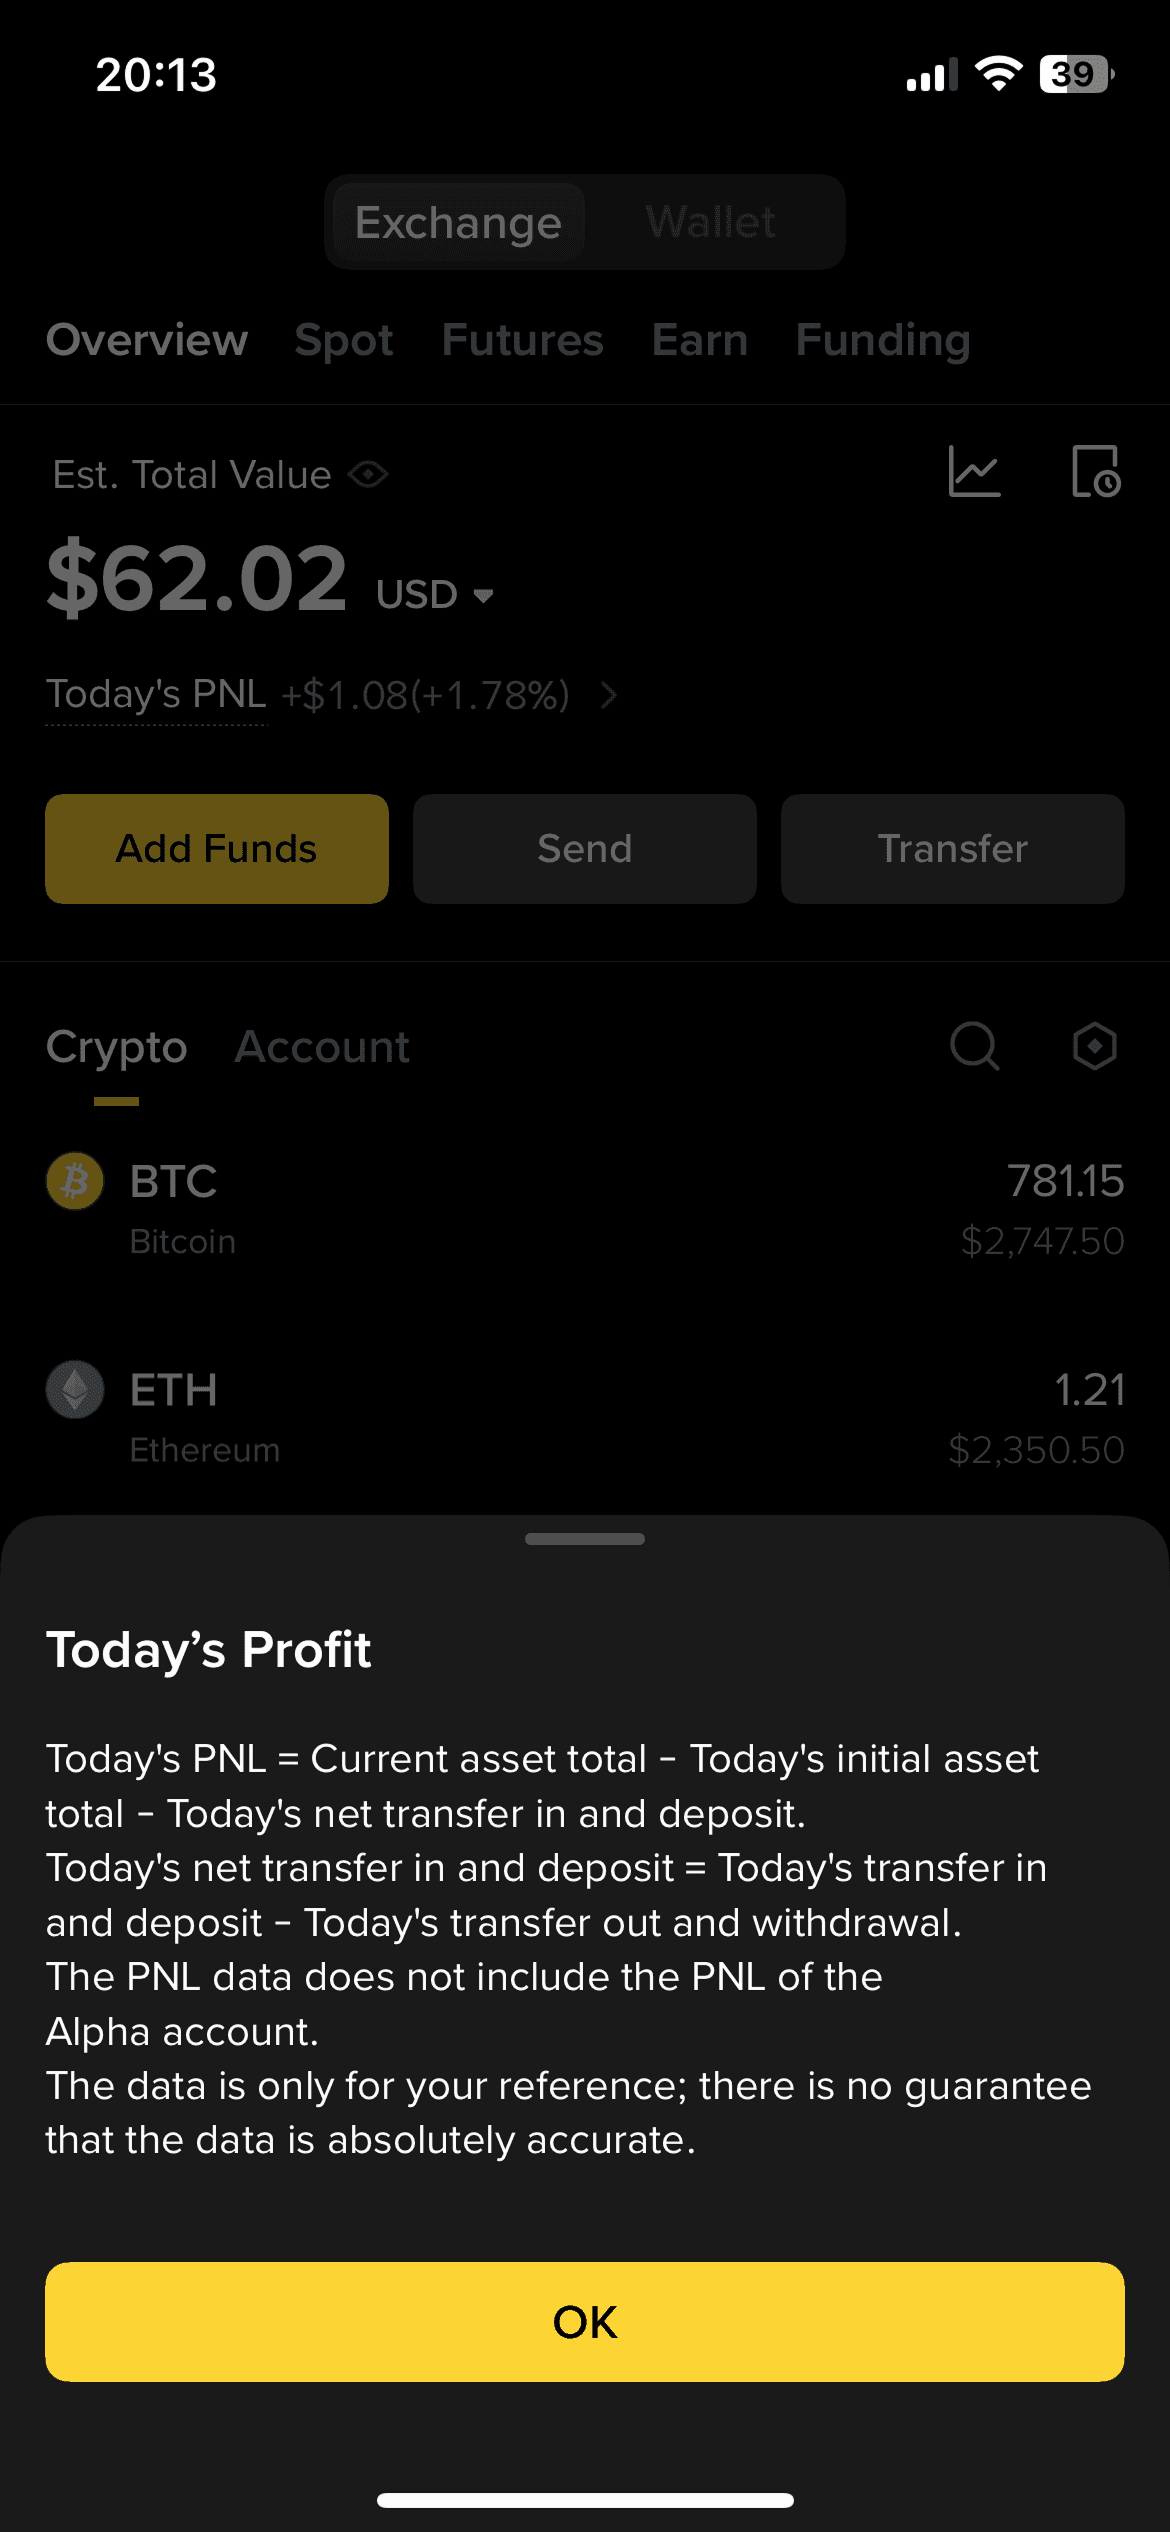
Technical language with unclear structure. Complex formulas and jargon made it hard to understand.
Simple, user-friendly language with clear breakdowns. Users can easily trace and verify their PNL now.
After

Before
The chart will expands after tapped
More
Transparent
Explanations
Clarifying asset trends with footnotes.
When users transfer between chains, trend charts may not reflect actual profit and loss. Footnotes help eliminate confusion.
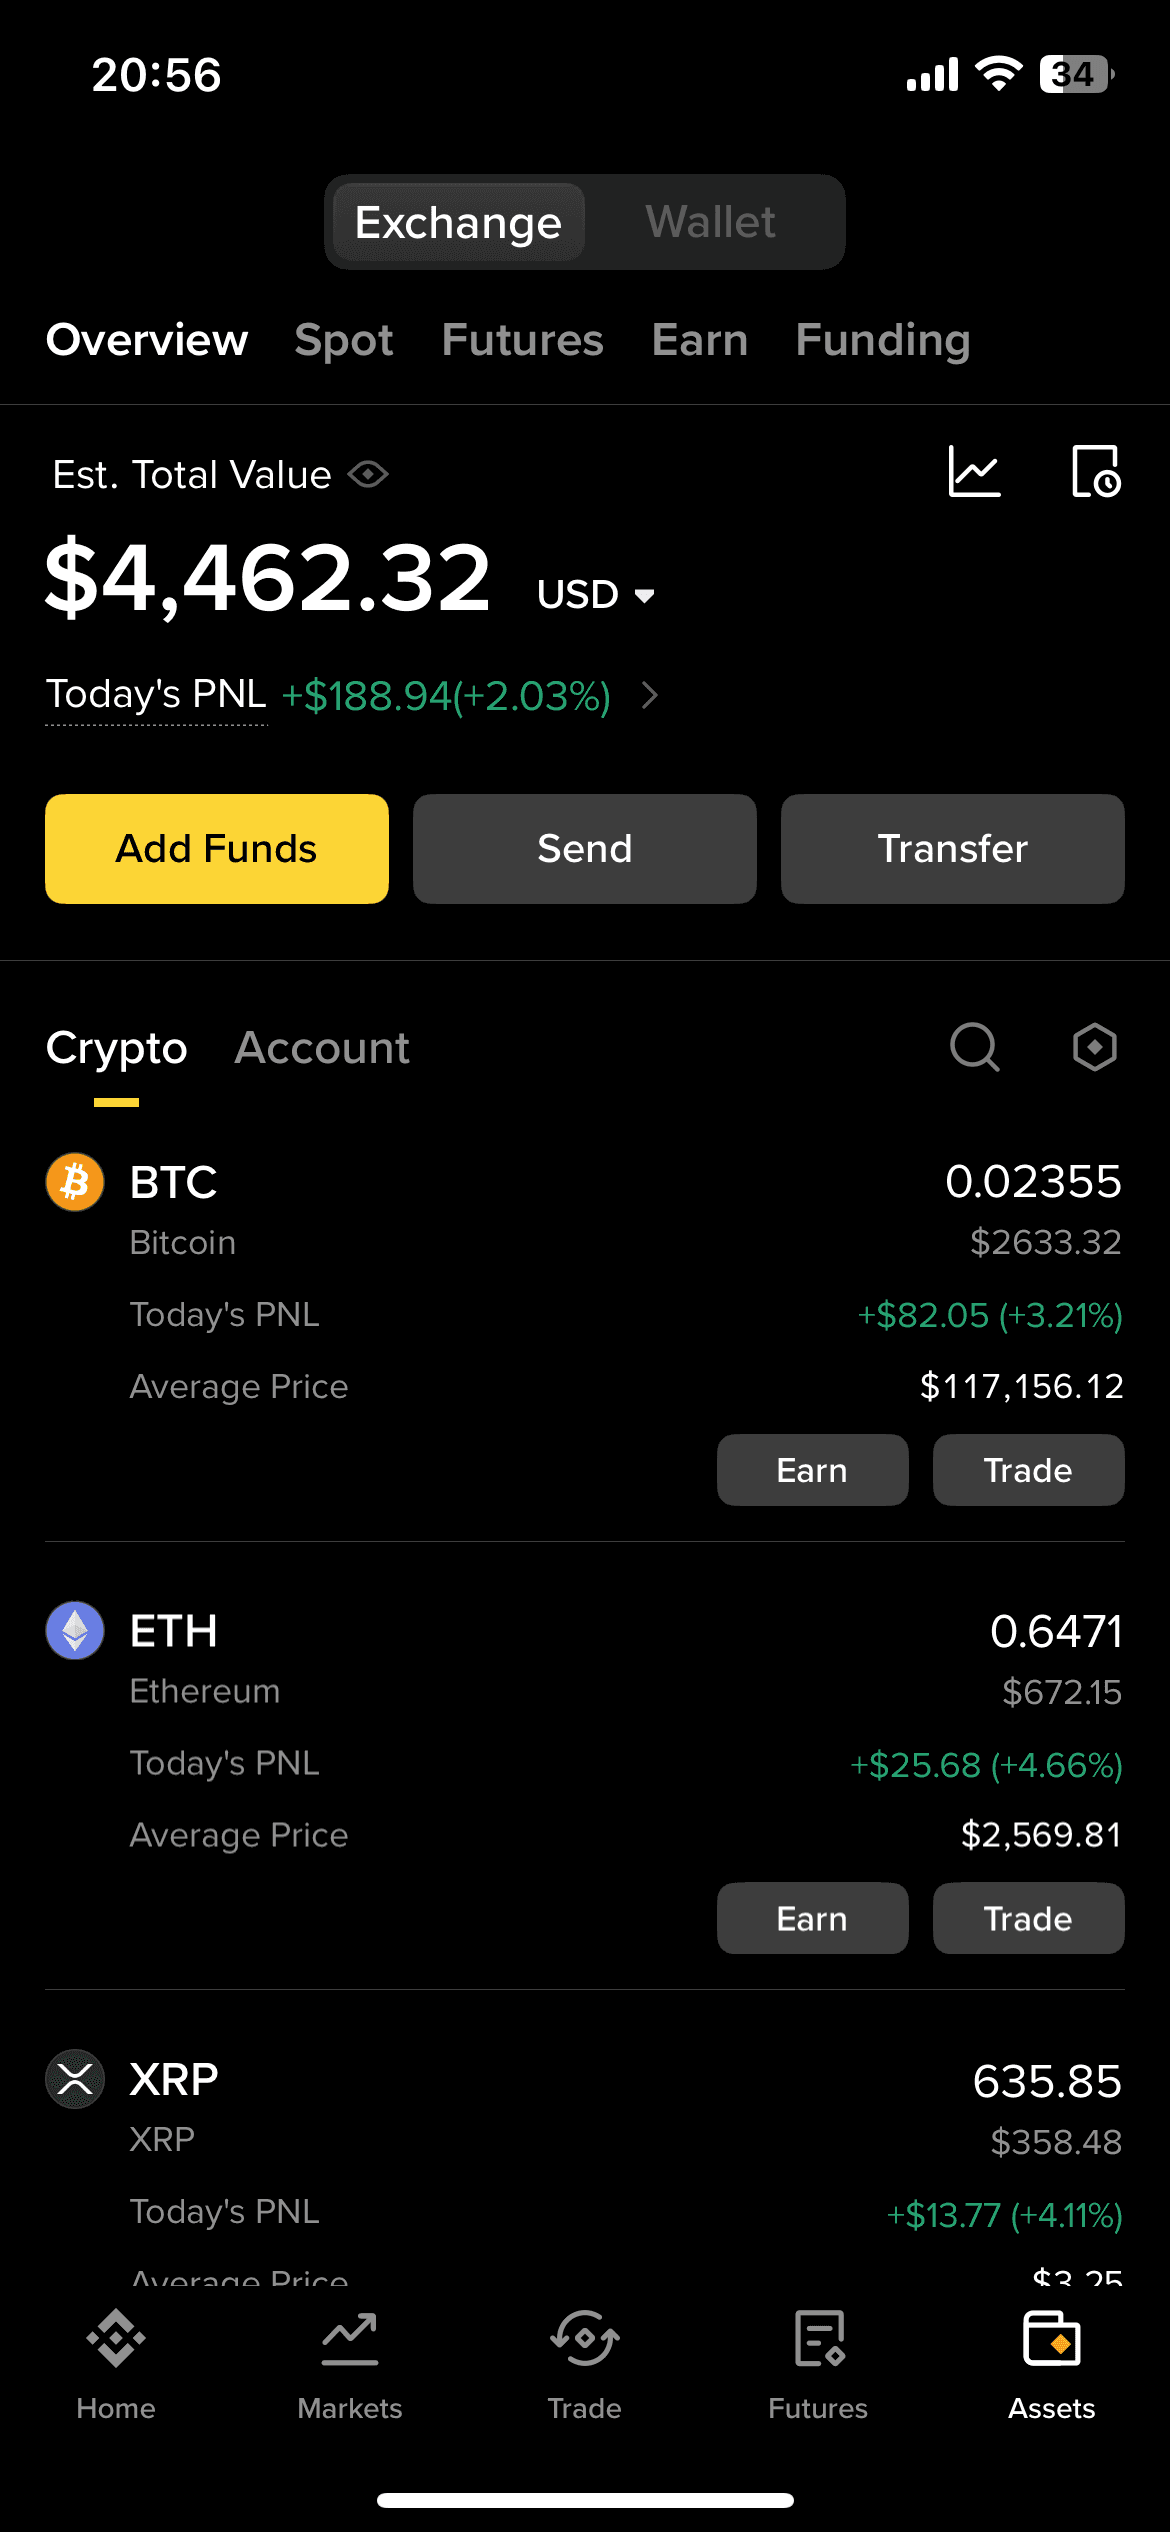
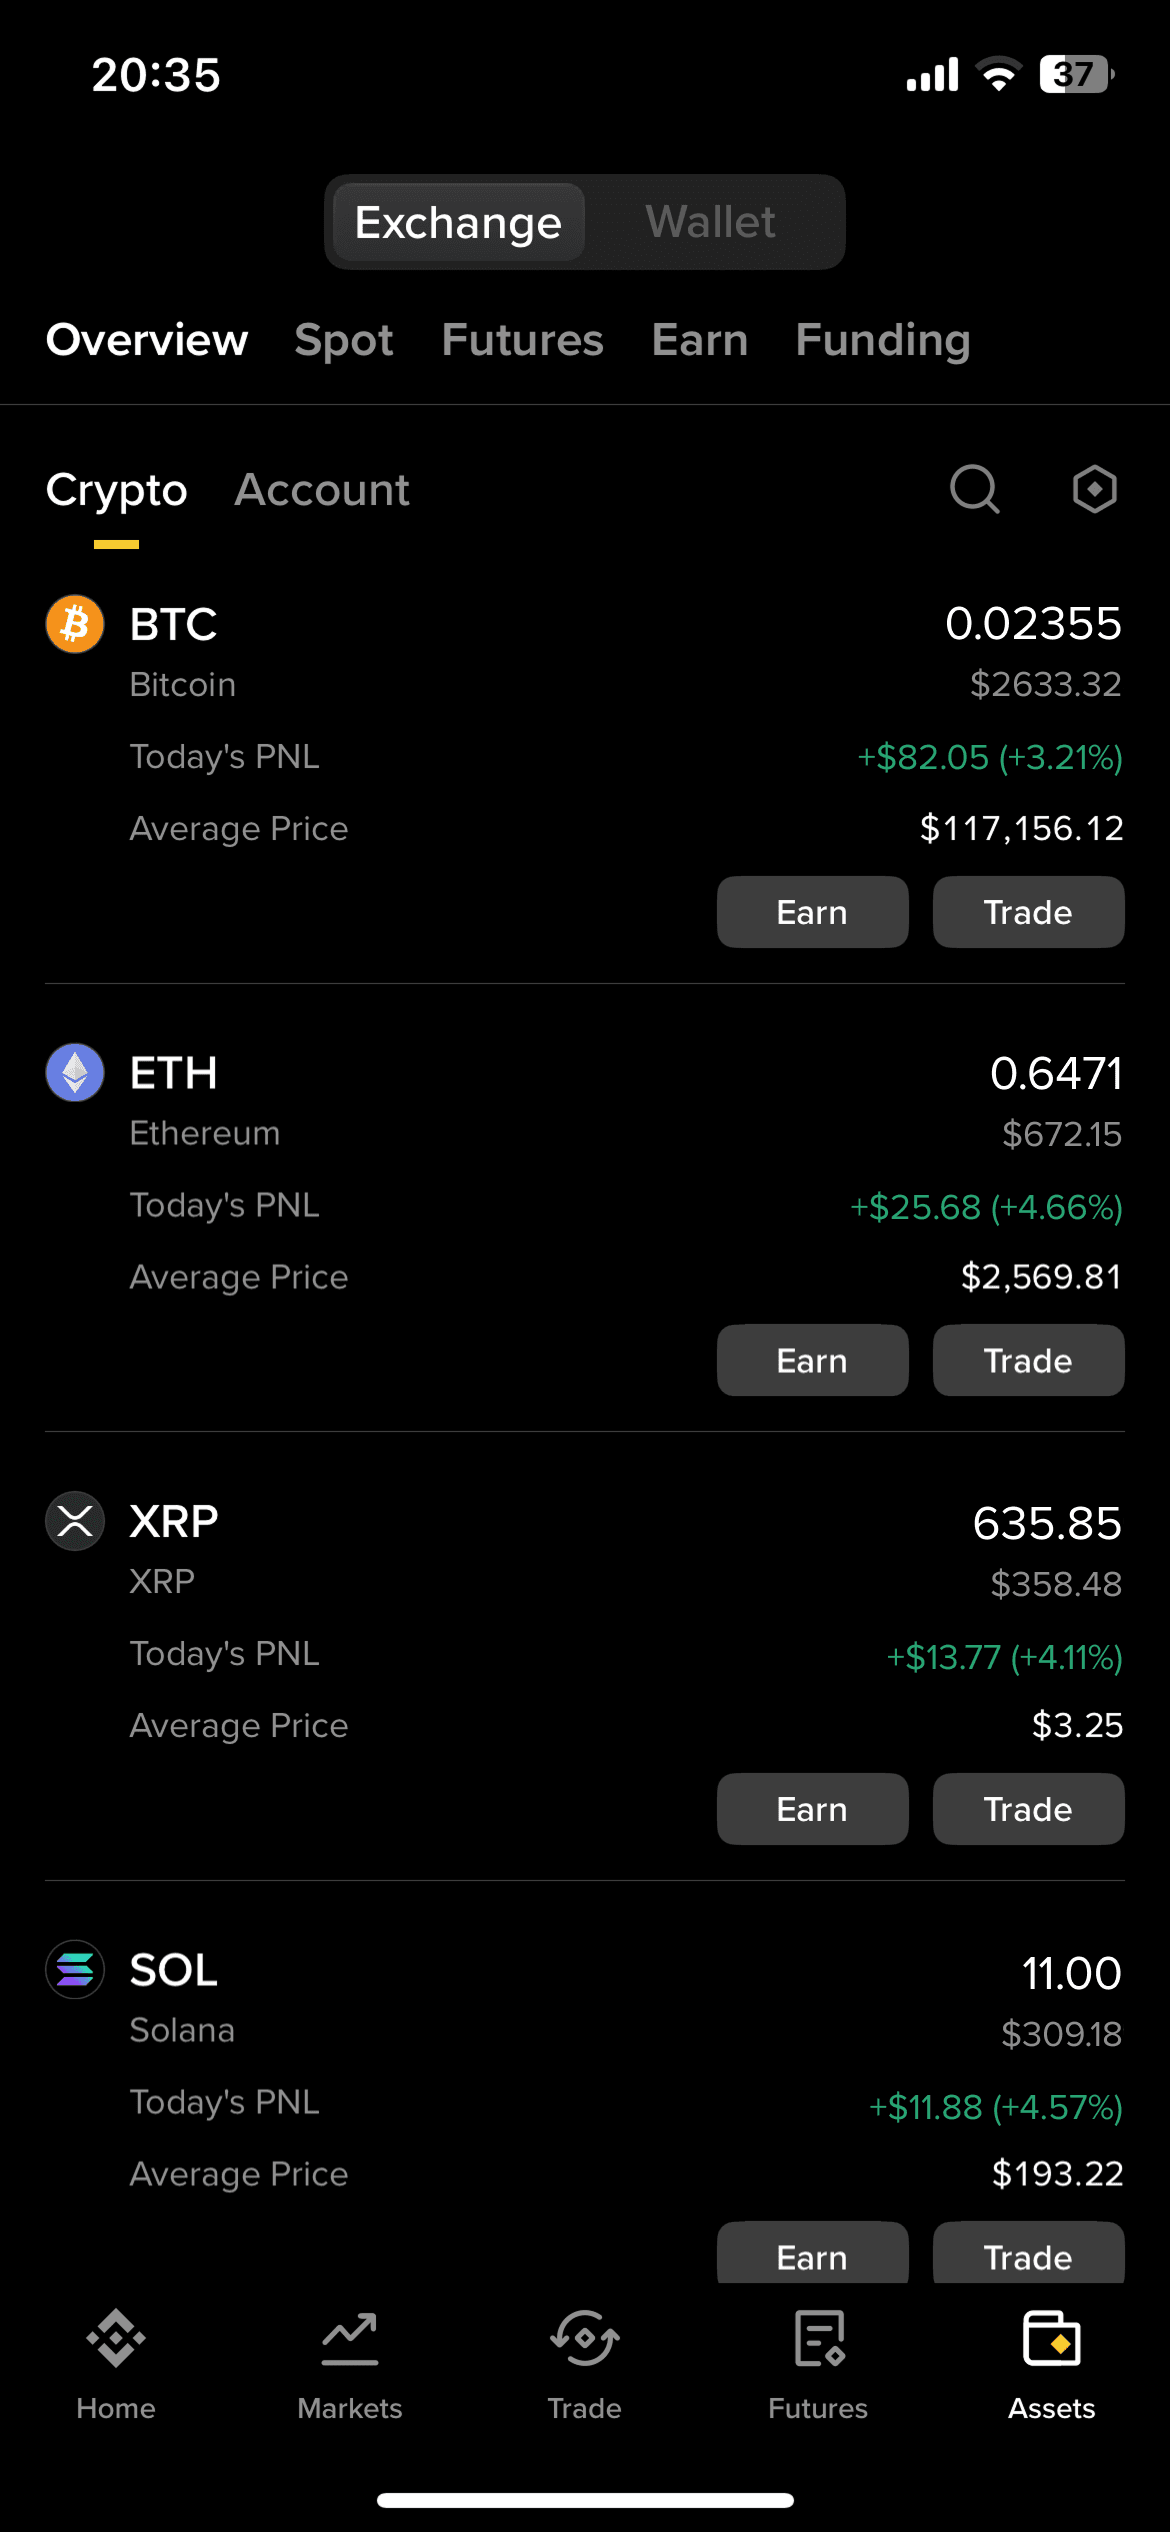
A smarter and readable list
Crypto by crypto
After
After
Before
Before
The list was filled with repetitive and useless info, making it hard to scan and visually overwhelming.
The chart was disconnected from the list and hard to find. It only showed account-level data, not coin-level breakdowns.
Redundant info is hidden to keep the list clean. Users can view detail with a simple tap, avoiding repeated navigation.
Chart entry placed beside the list, makes it easier to access and supports switching between account and coin views.
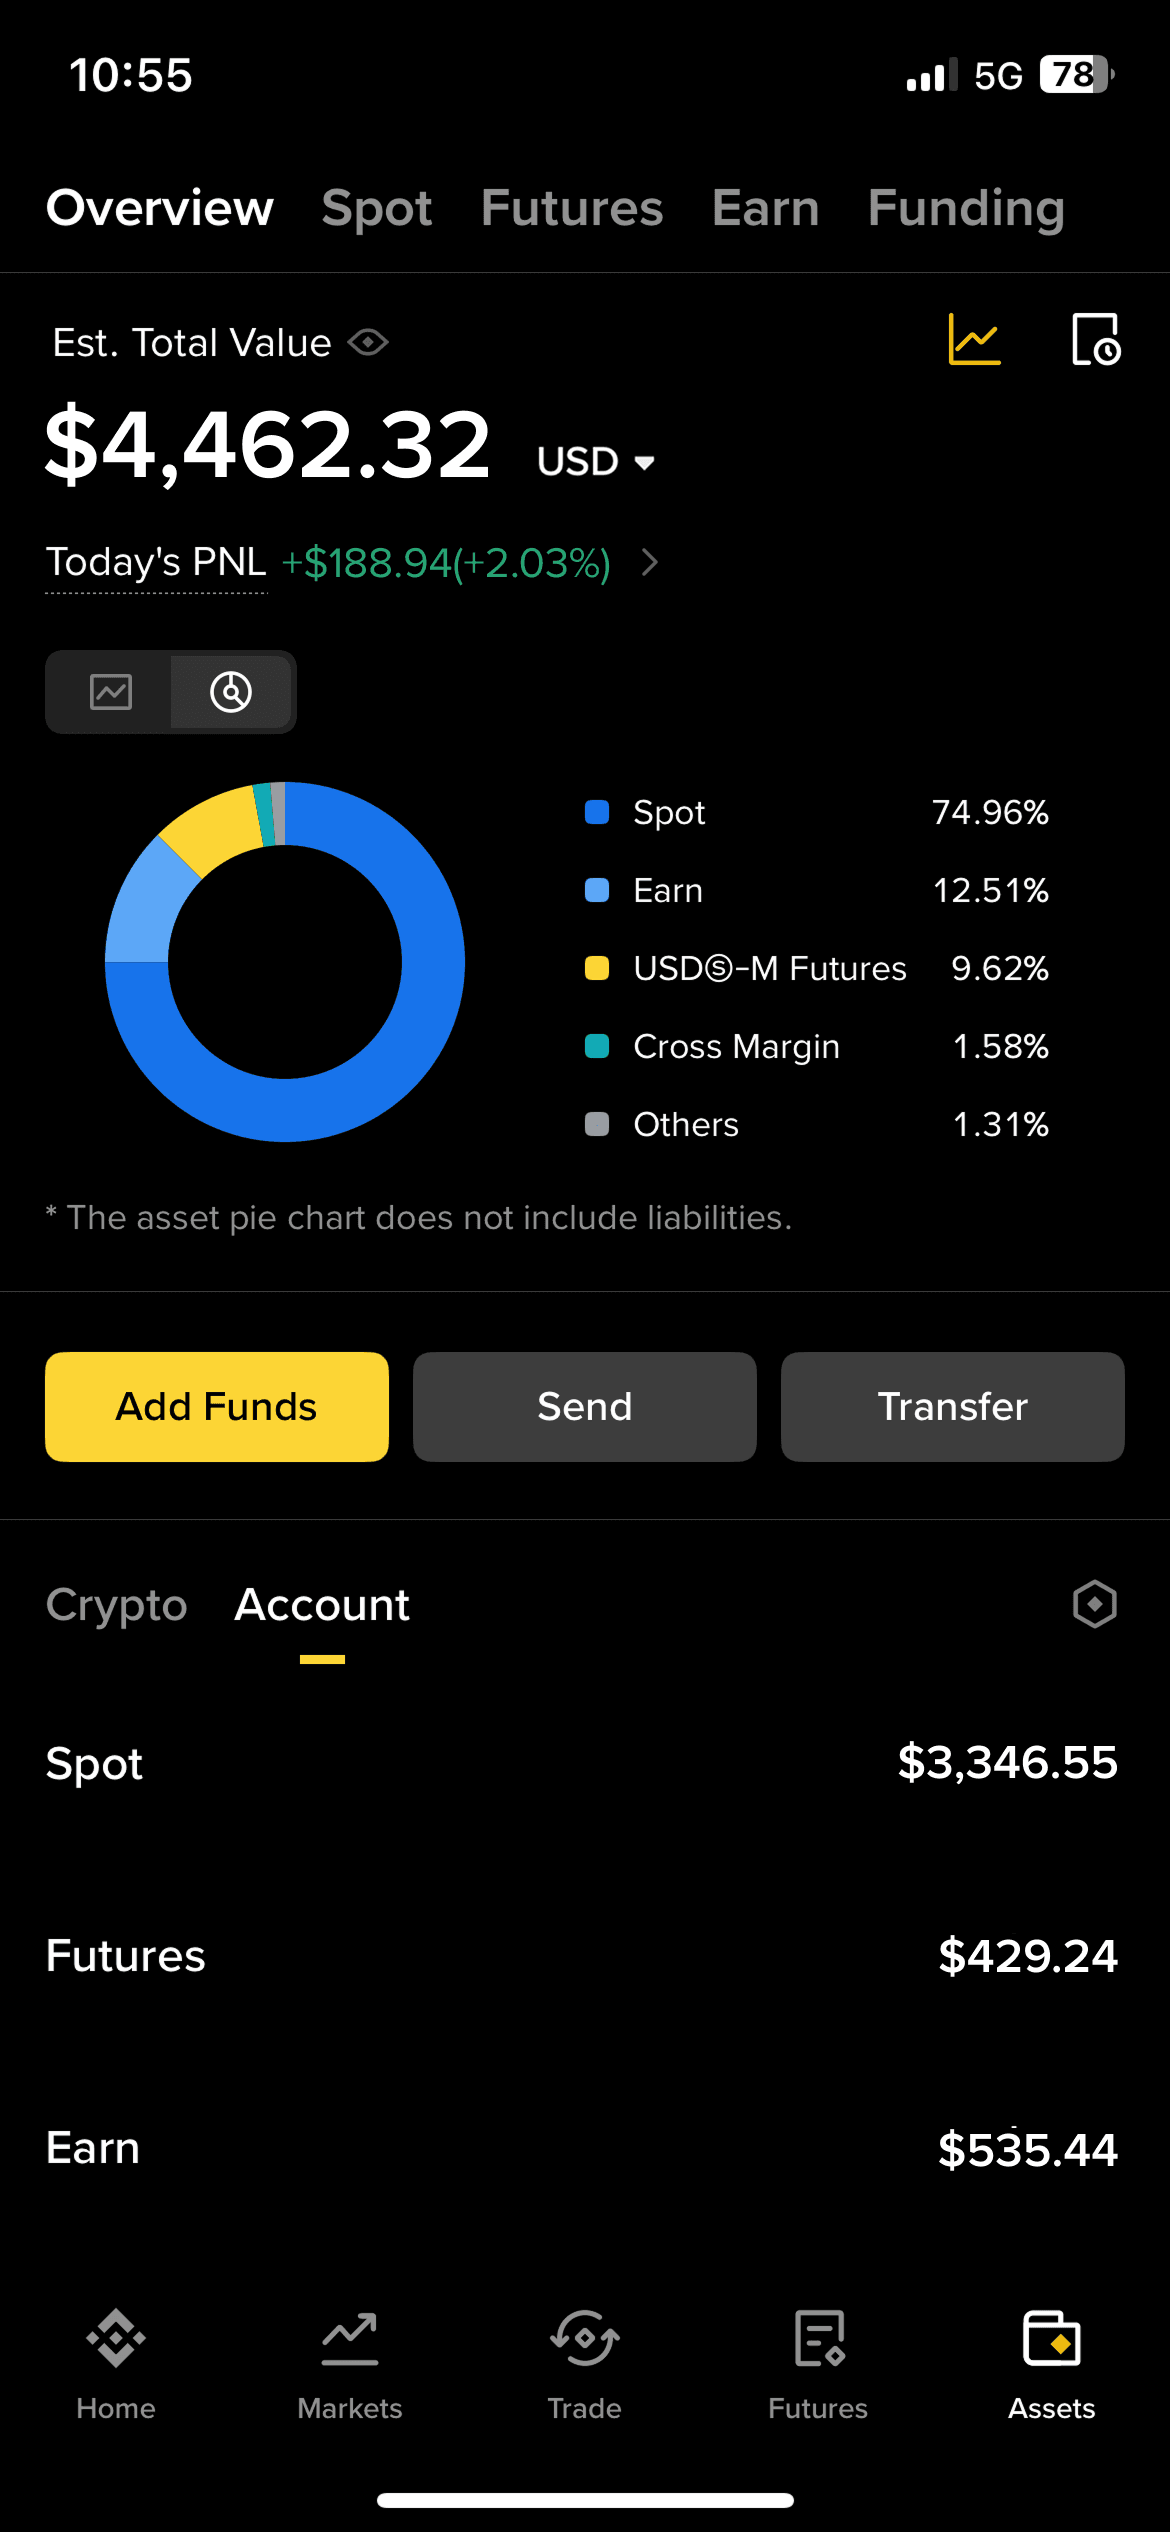
A more contextual pie chart
More
Insightful
Asset Report
From isolated data
To progressive Insights
After
Before


Scattered metrics presented in isolation, offering limited clarity on performance drivers.
Structured, multi-dimensional insights with clear attribution, delivered progressively for better understanding.
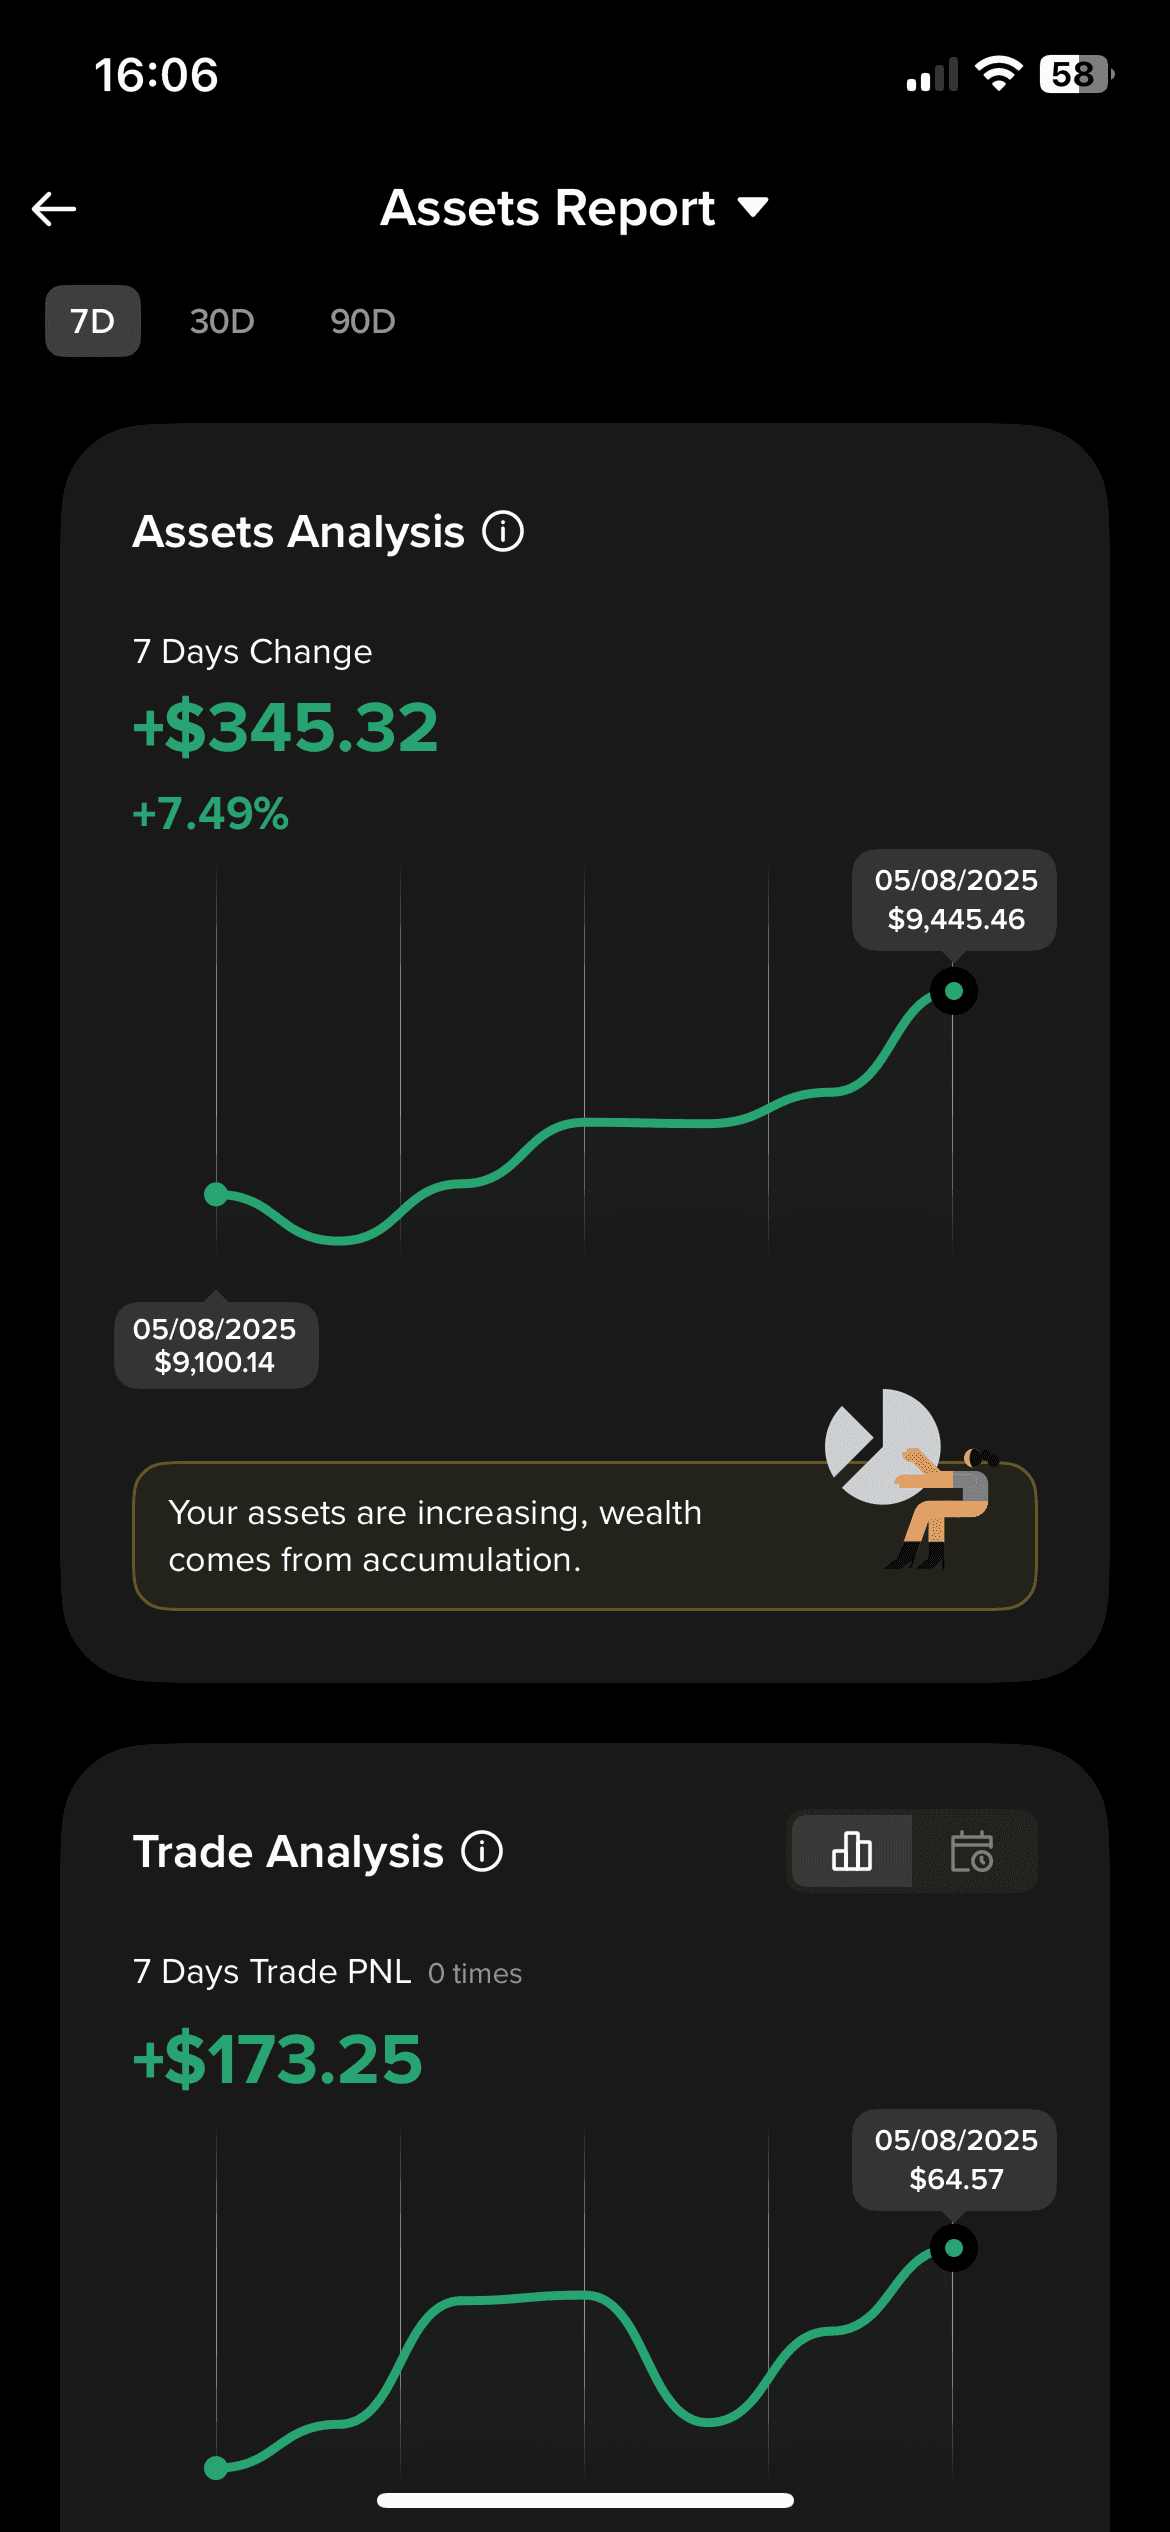
Asset Analysis
Includes chain conversion, which can cause misunderstanding
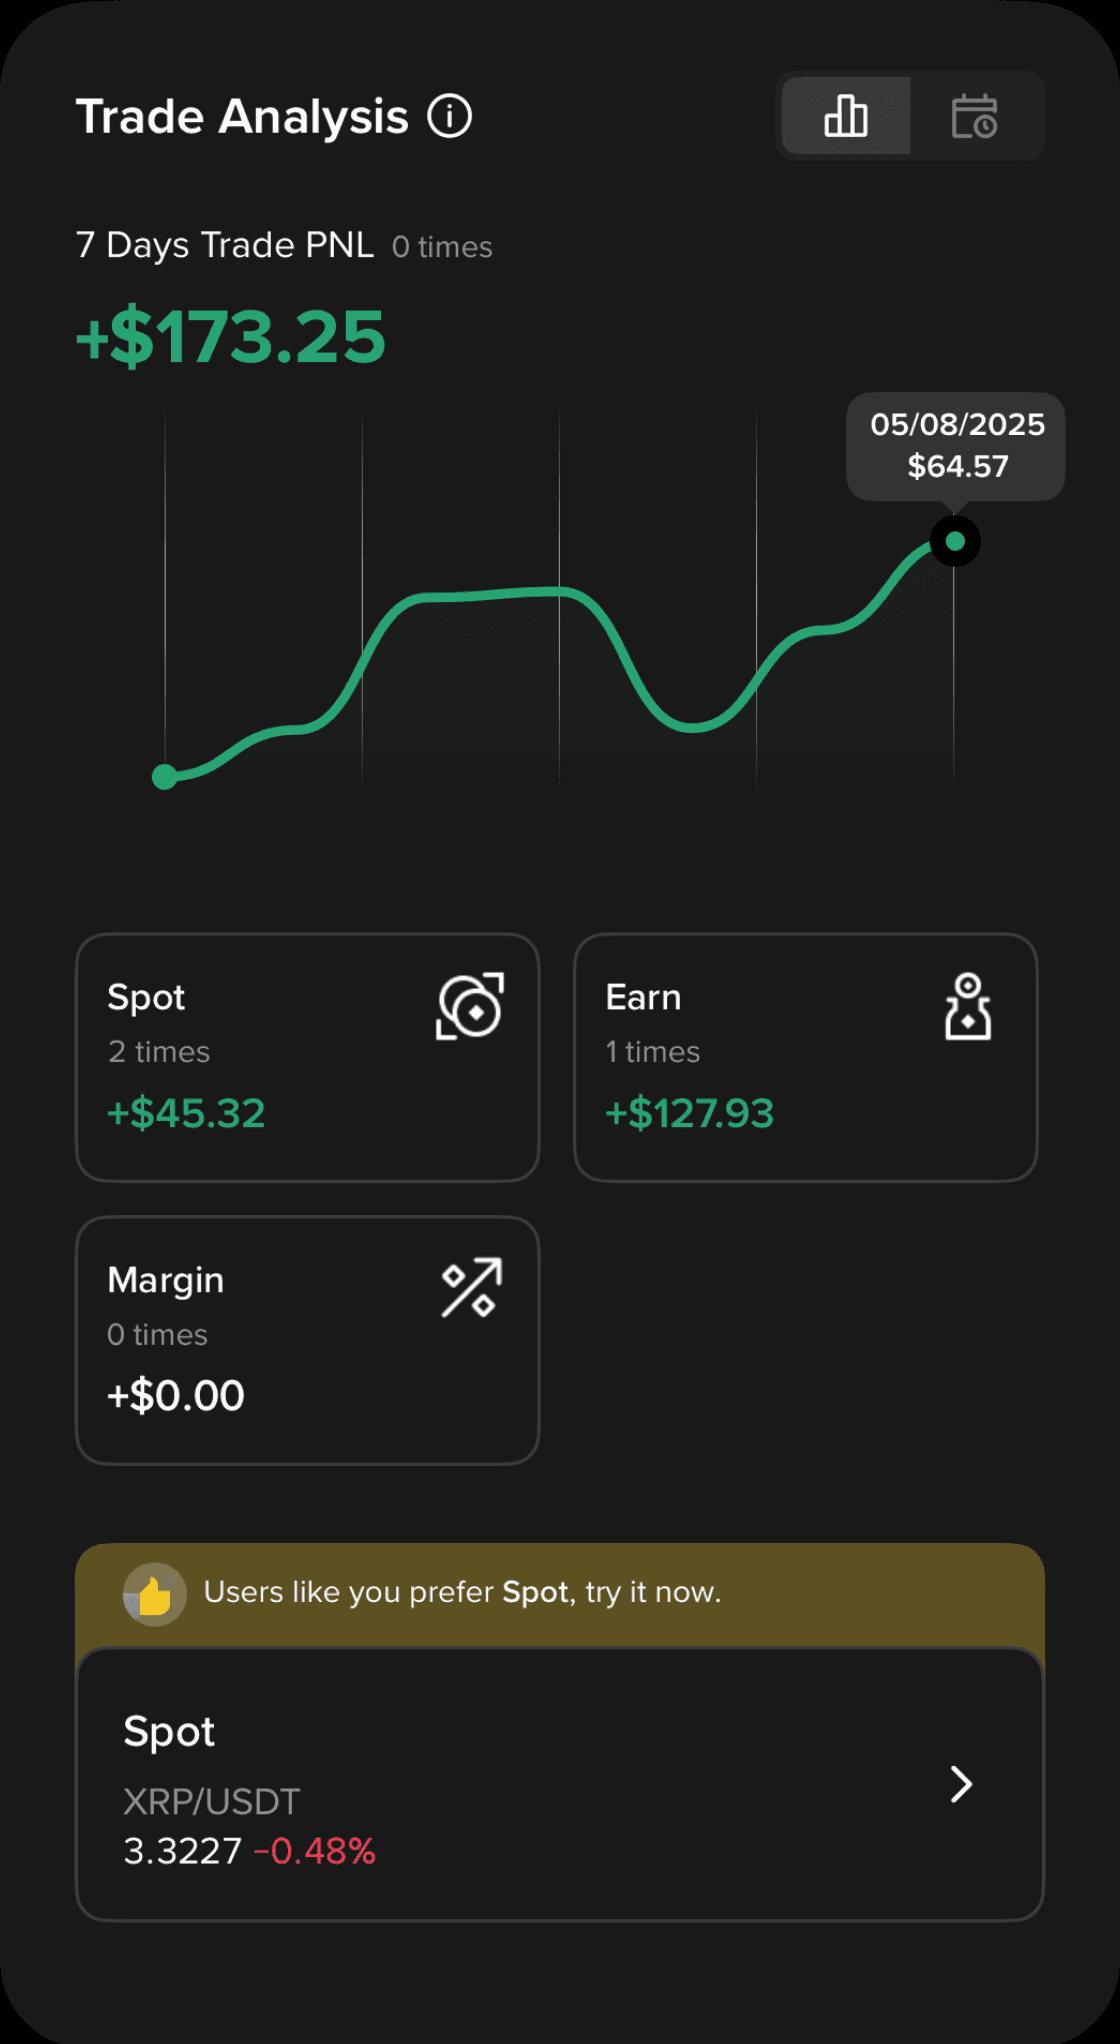
Trading PNL Analysis
Counts trades and PNL by account, but hard to link to specific reasons
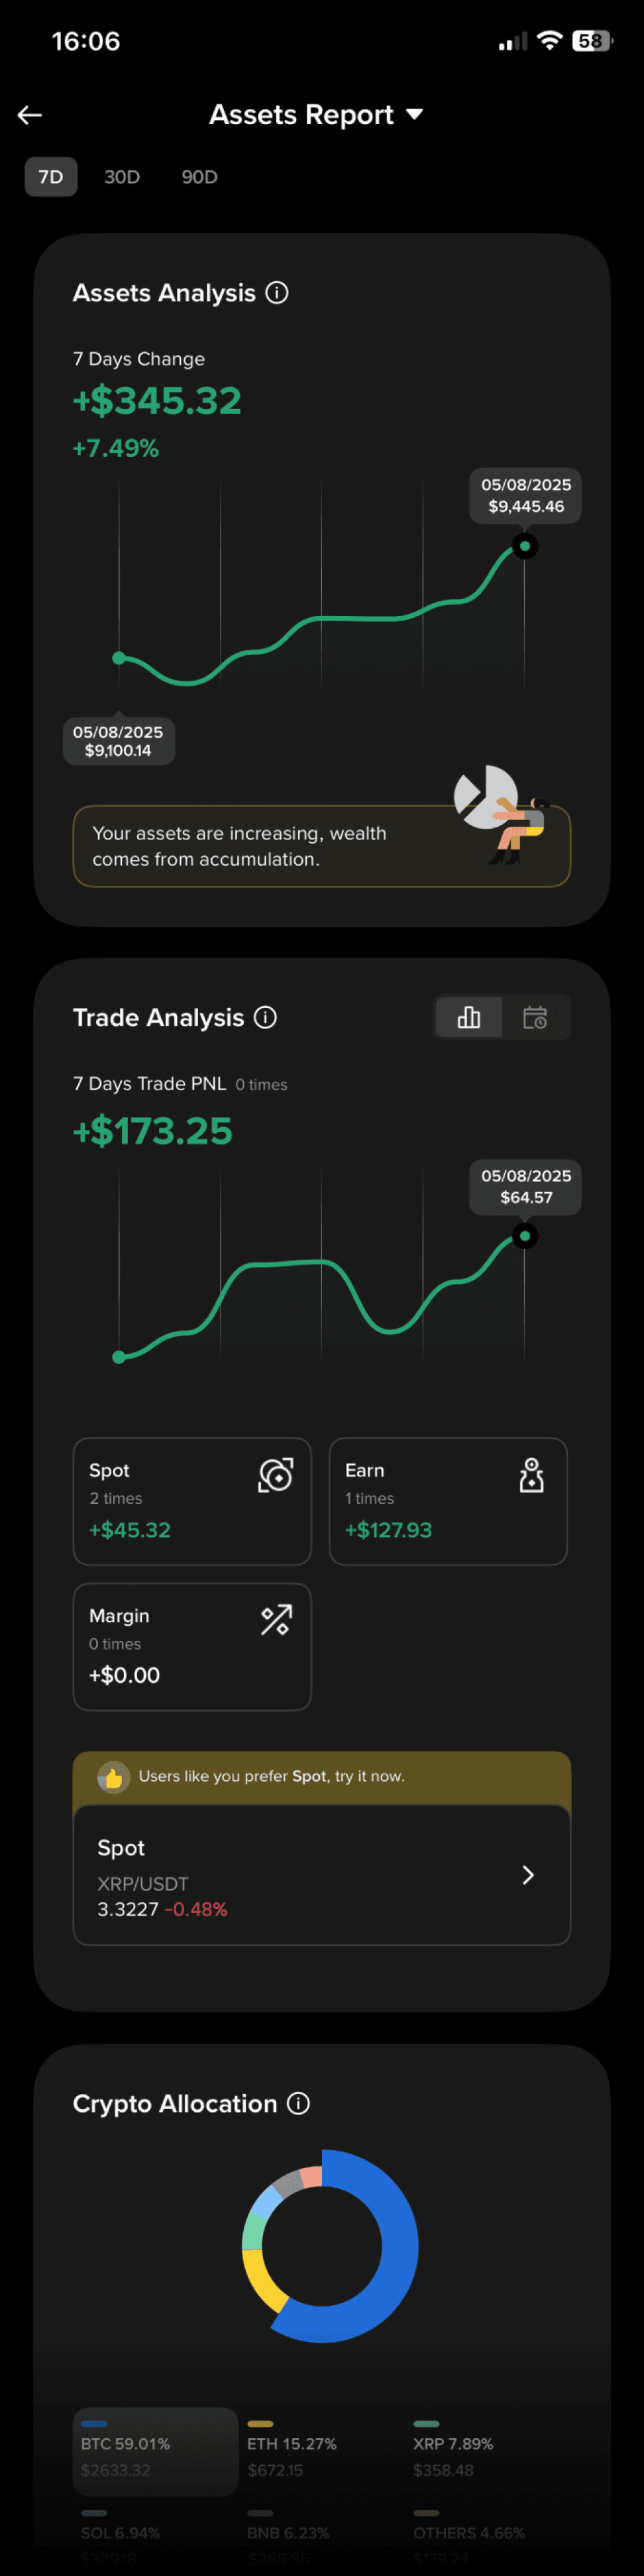
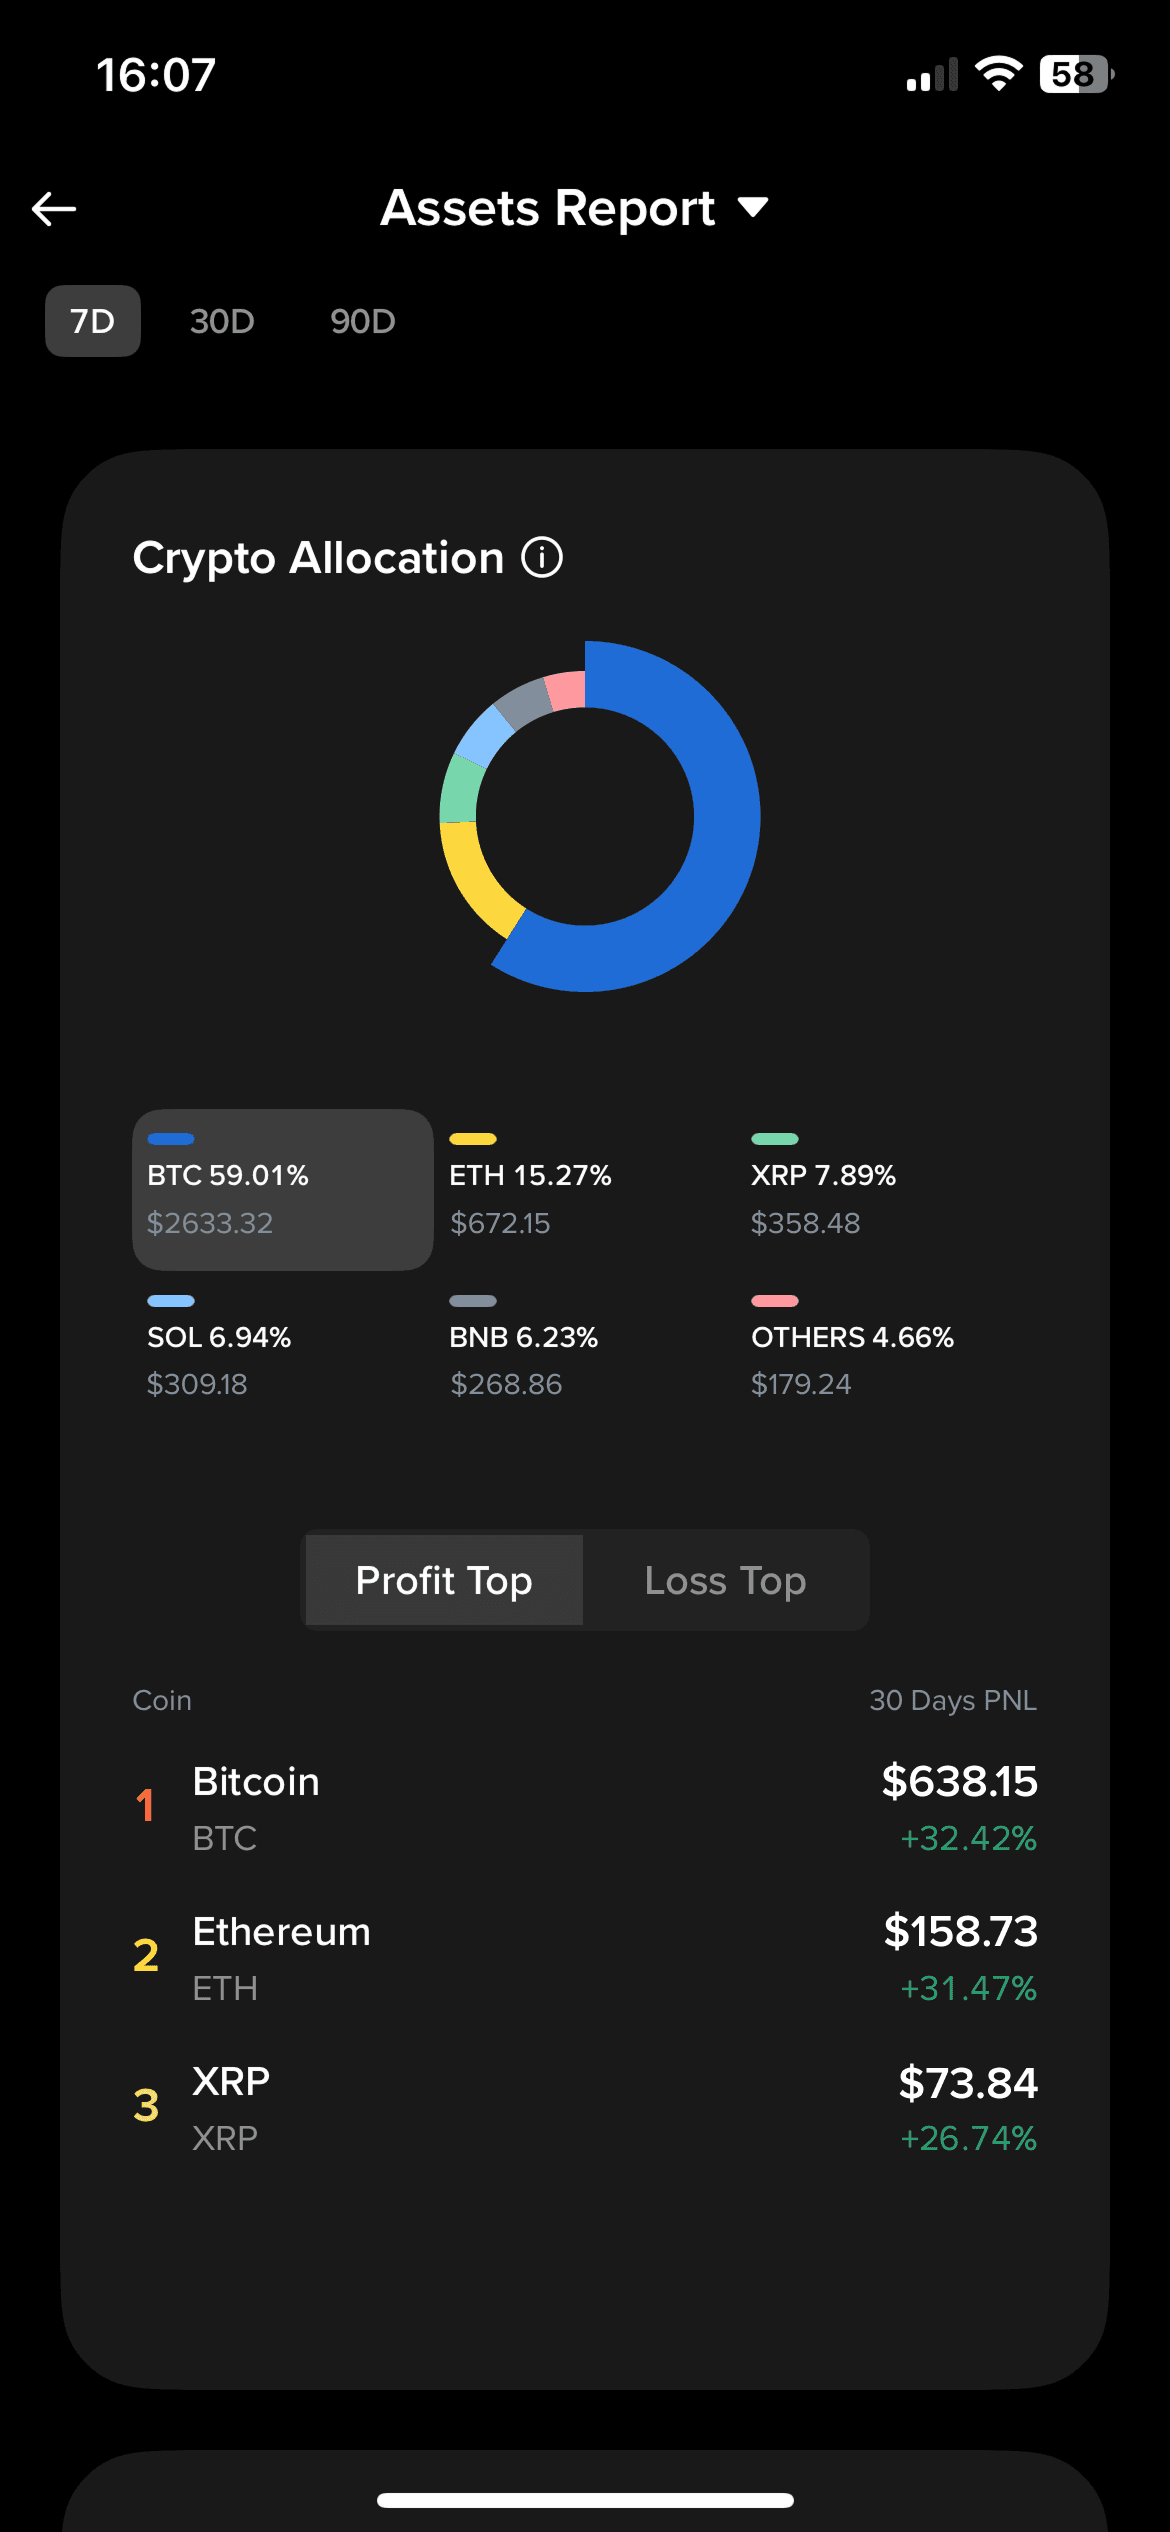
Crypto Allocation
Only shows distribution by crypto type in one dimension
Top3 Profit and Lost crypto
Shows PNL on crypto level is hard to link to specific reasons
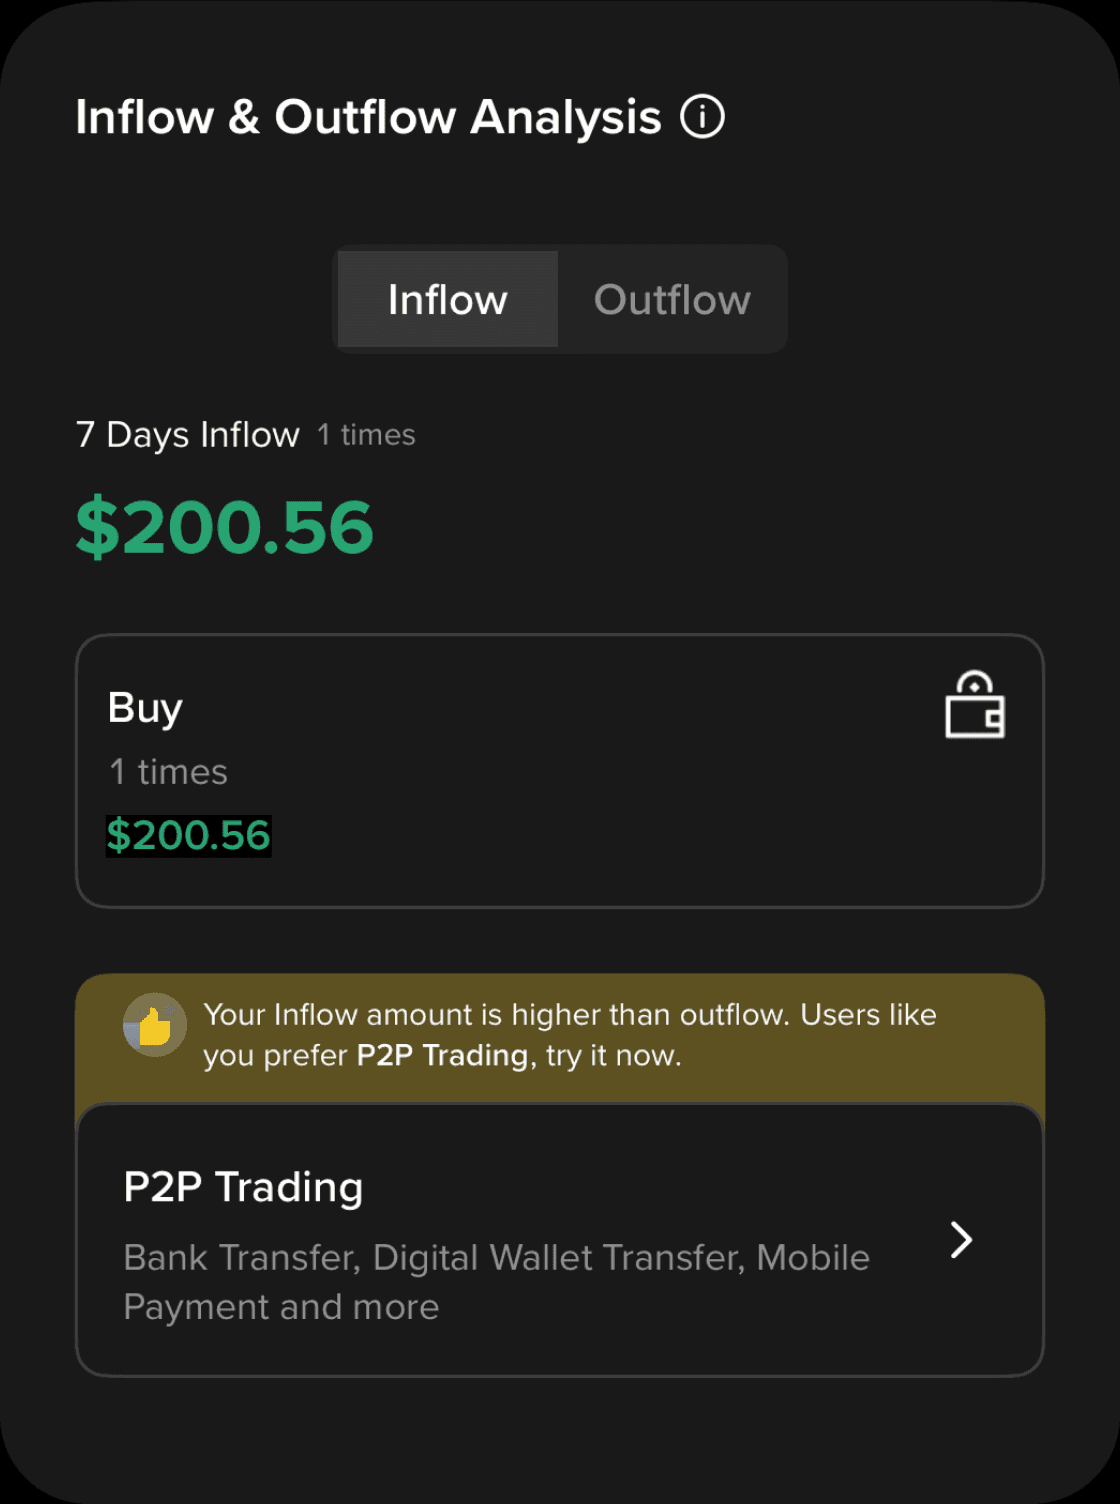
Inflow & Outflow Analysis
Risk Evaluation
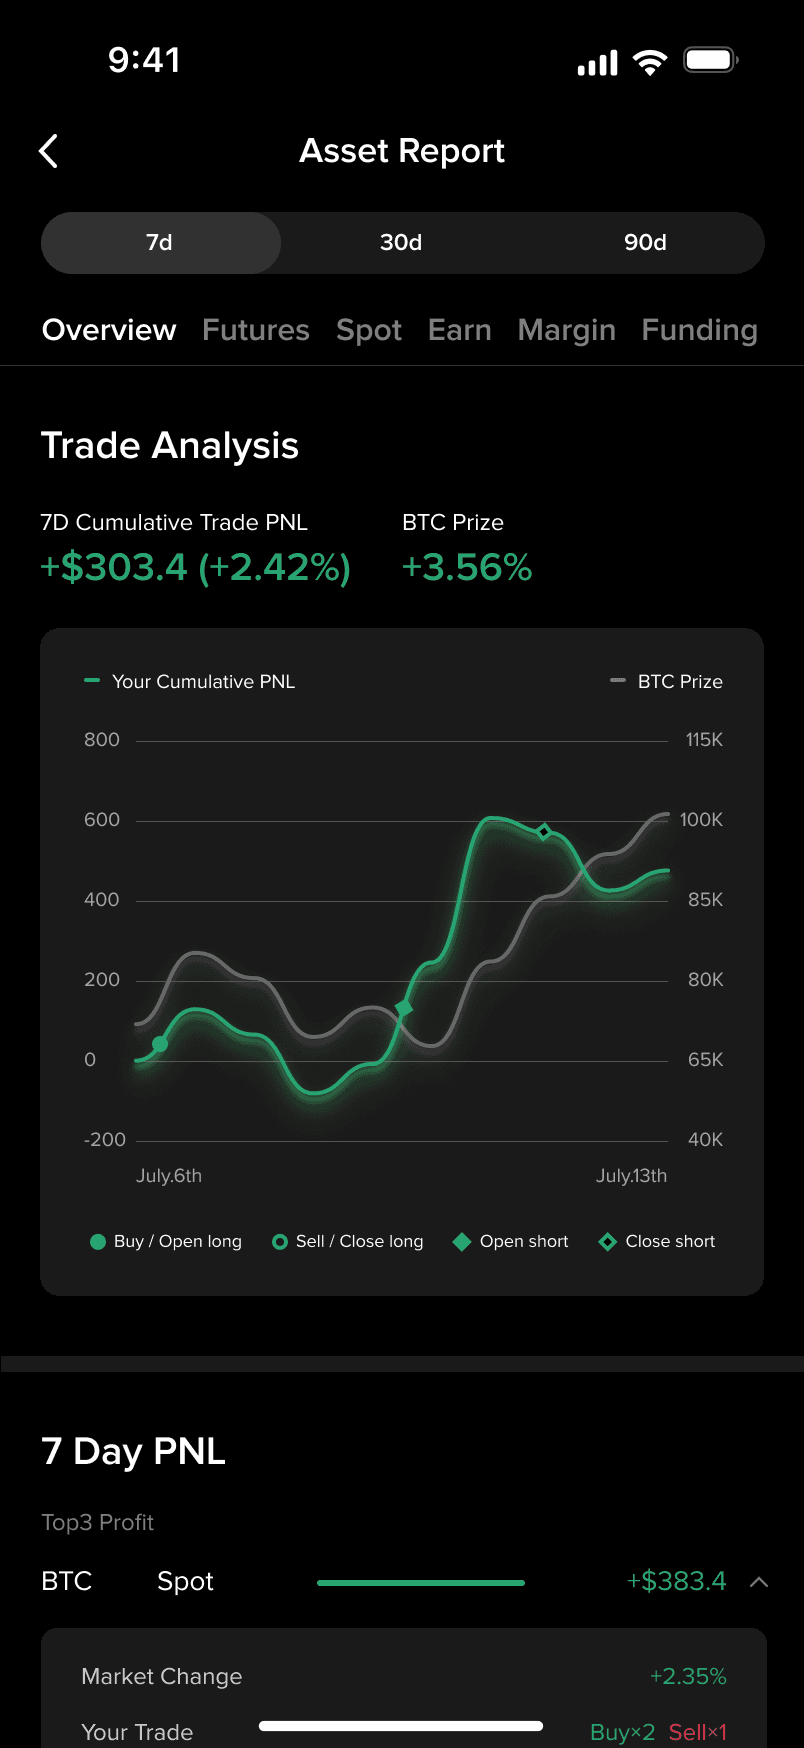
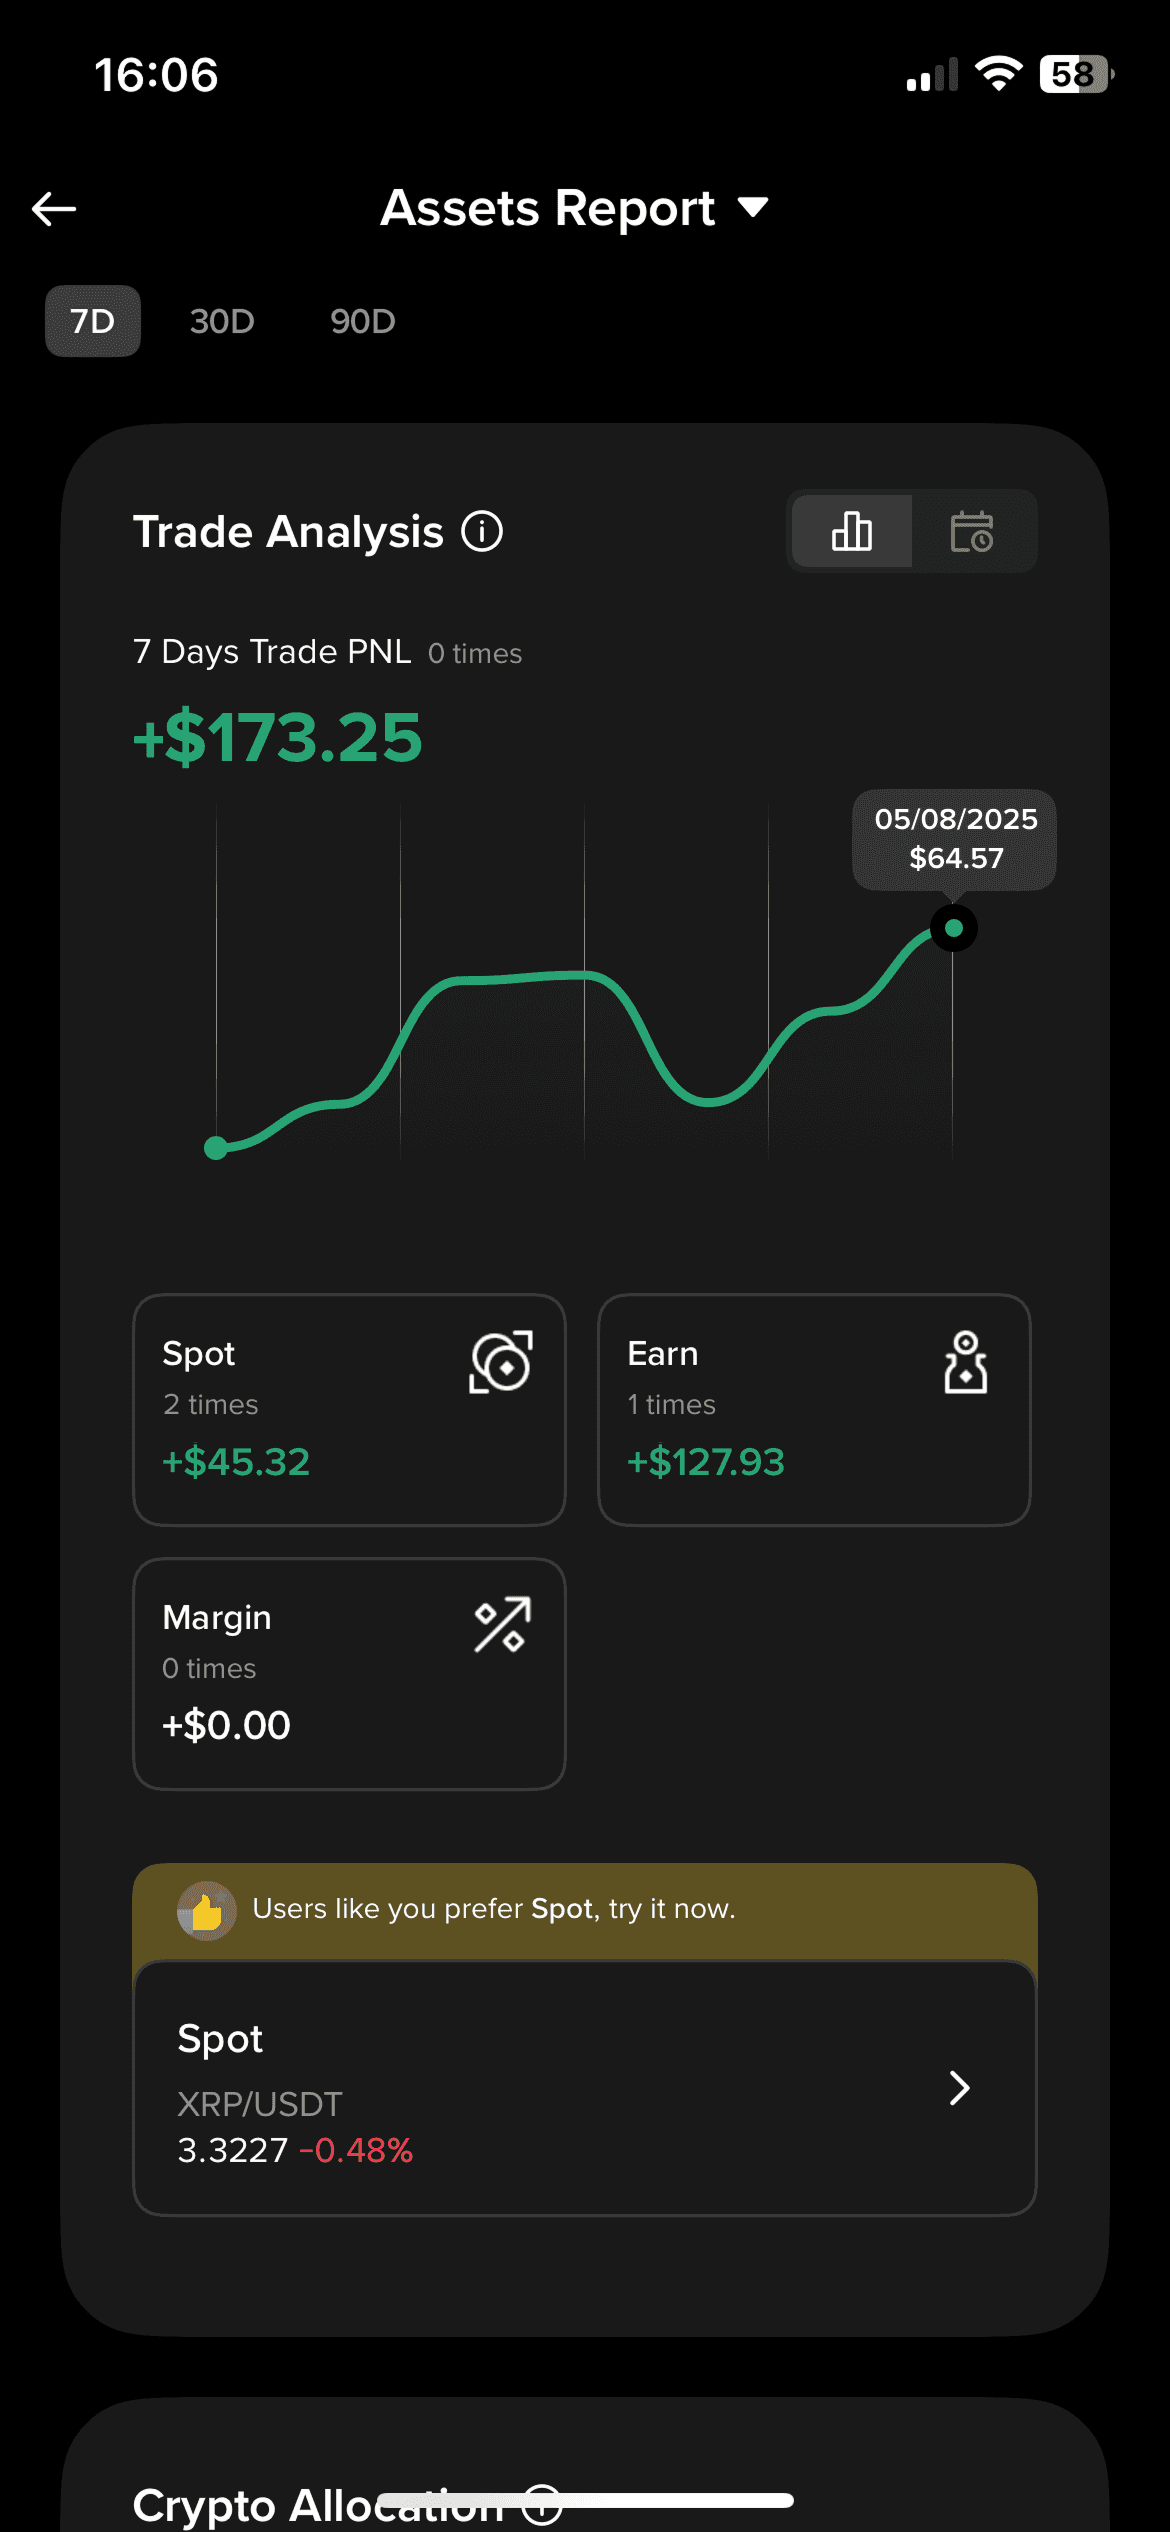
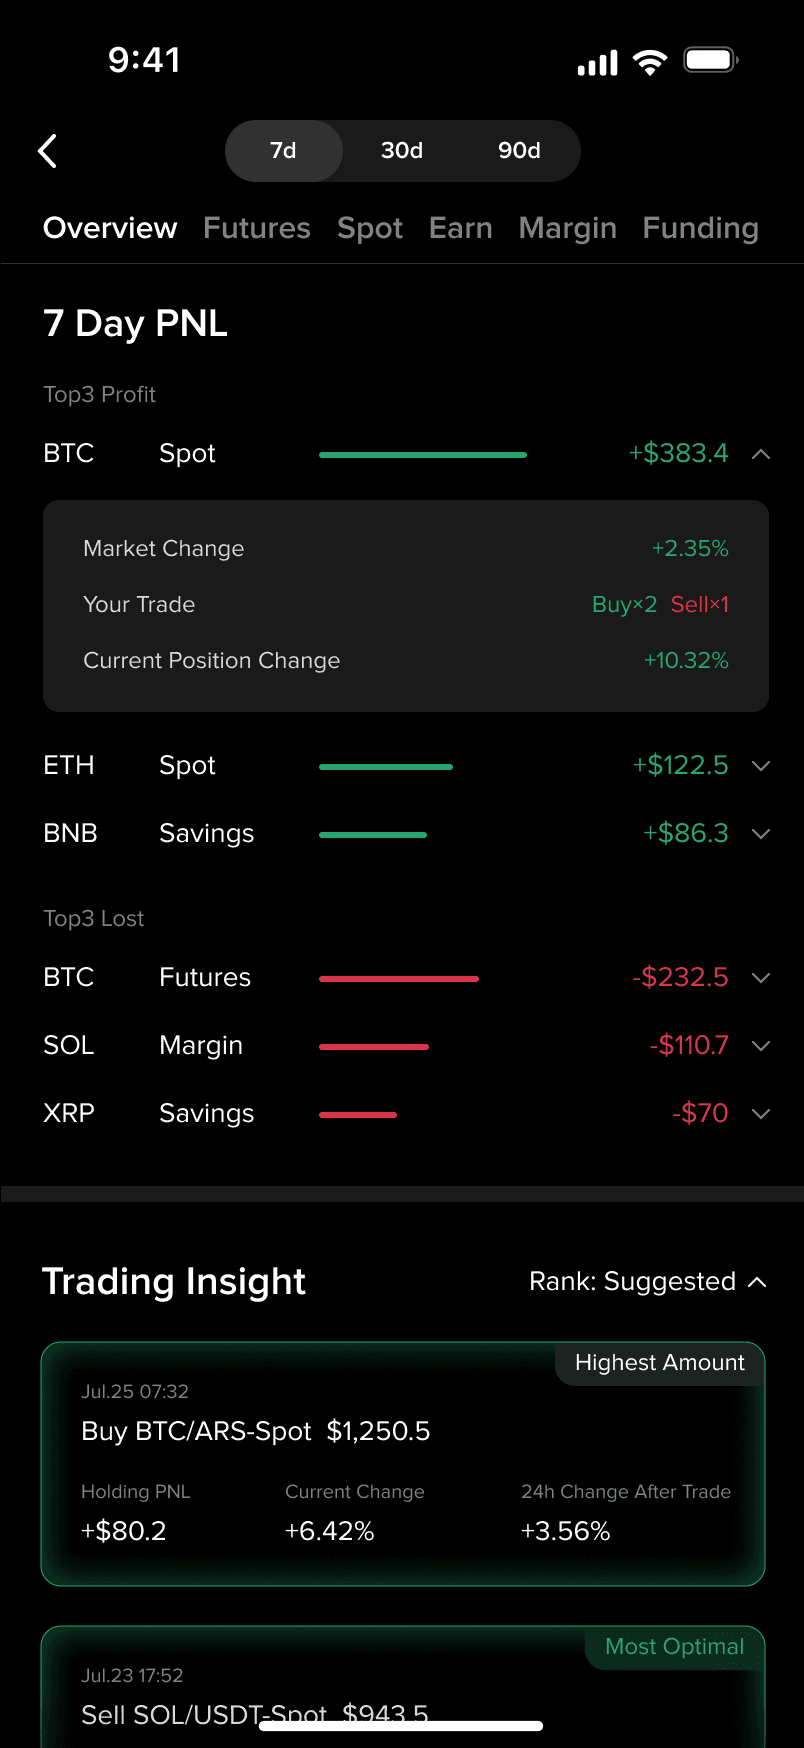
Overview of Trade and Market
Shows trading returns, market changes, and user behavior for a quick view of recent performance
PNL Attribution
Shows top 3 gain/loss cryptos and products, with direct reasons
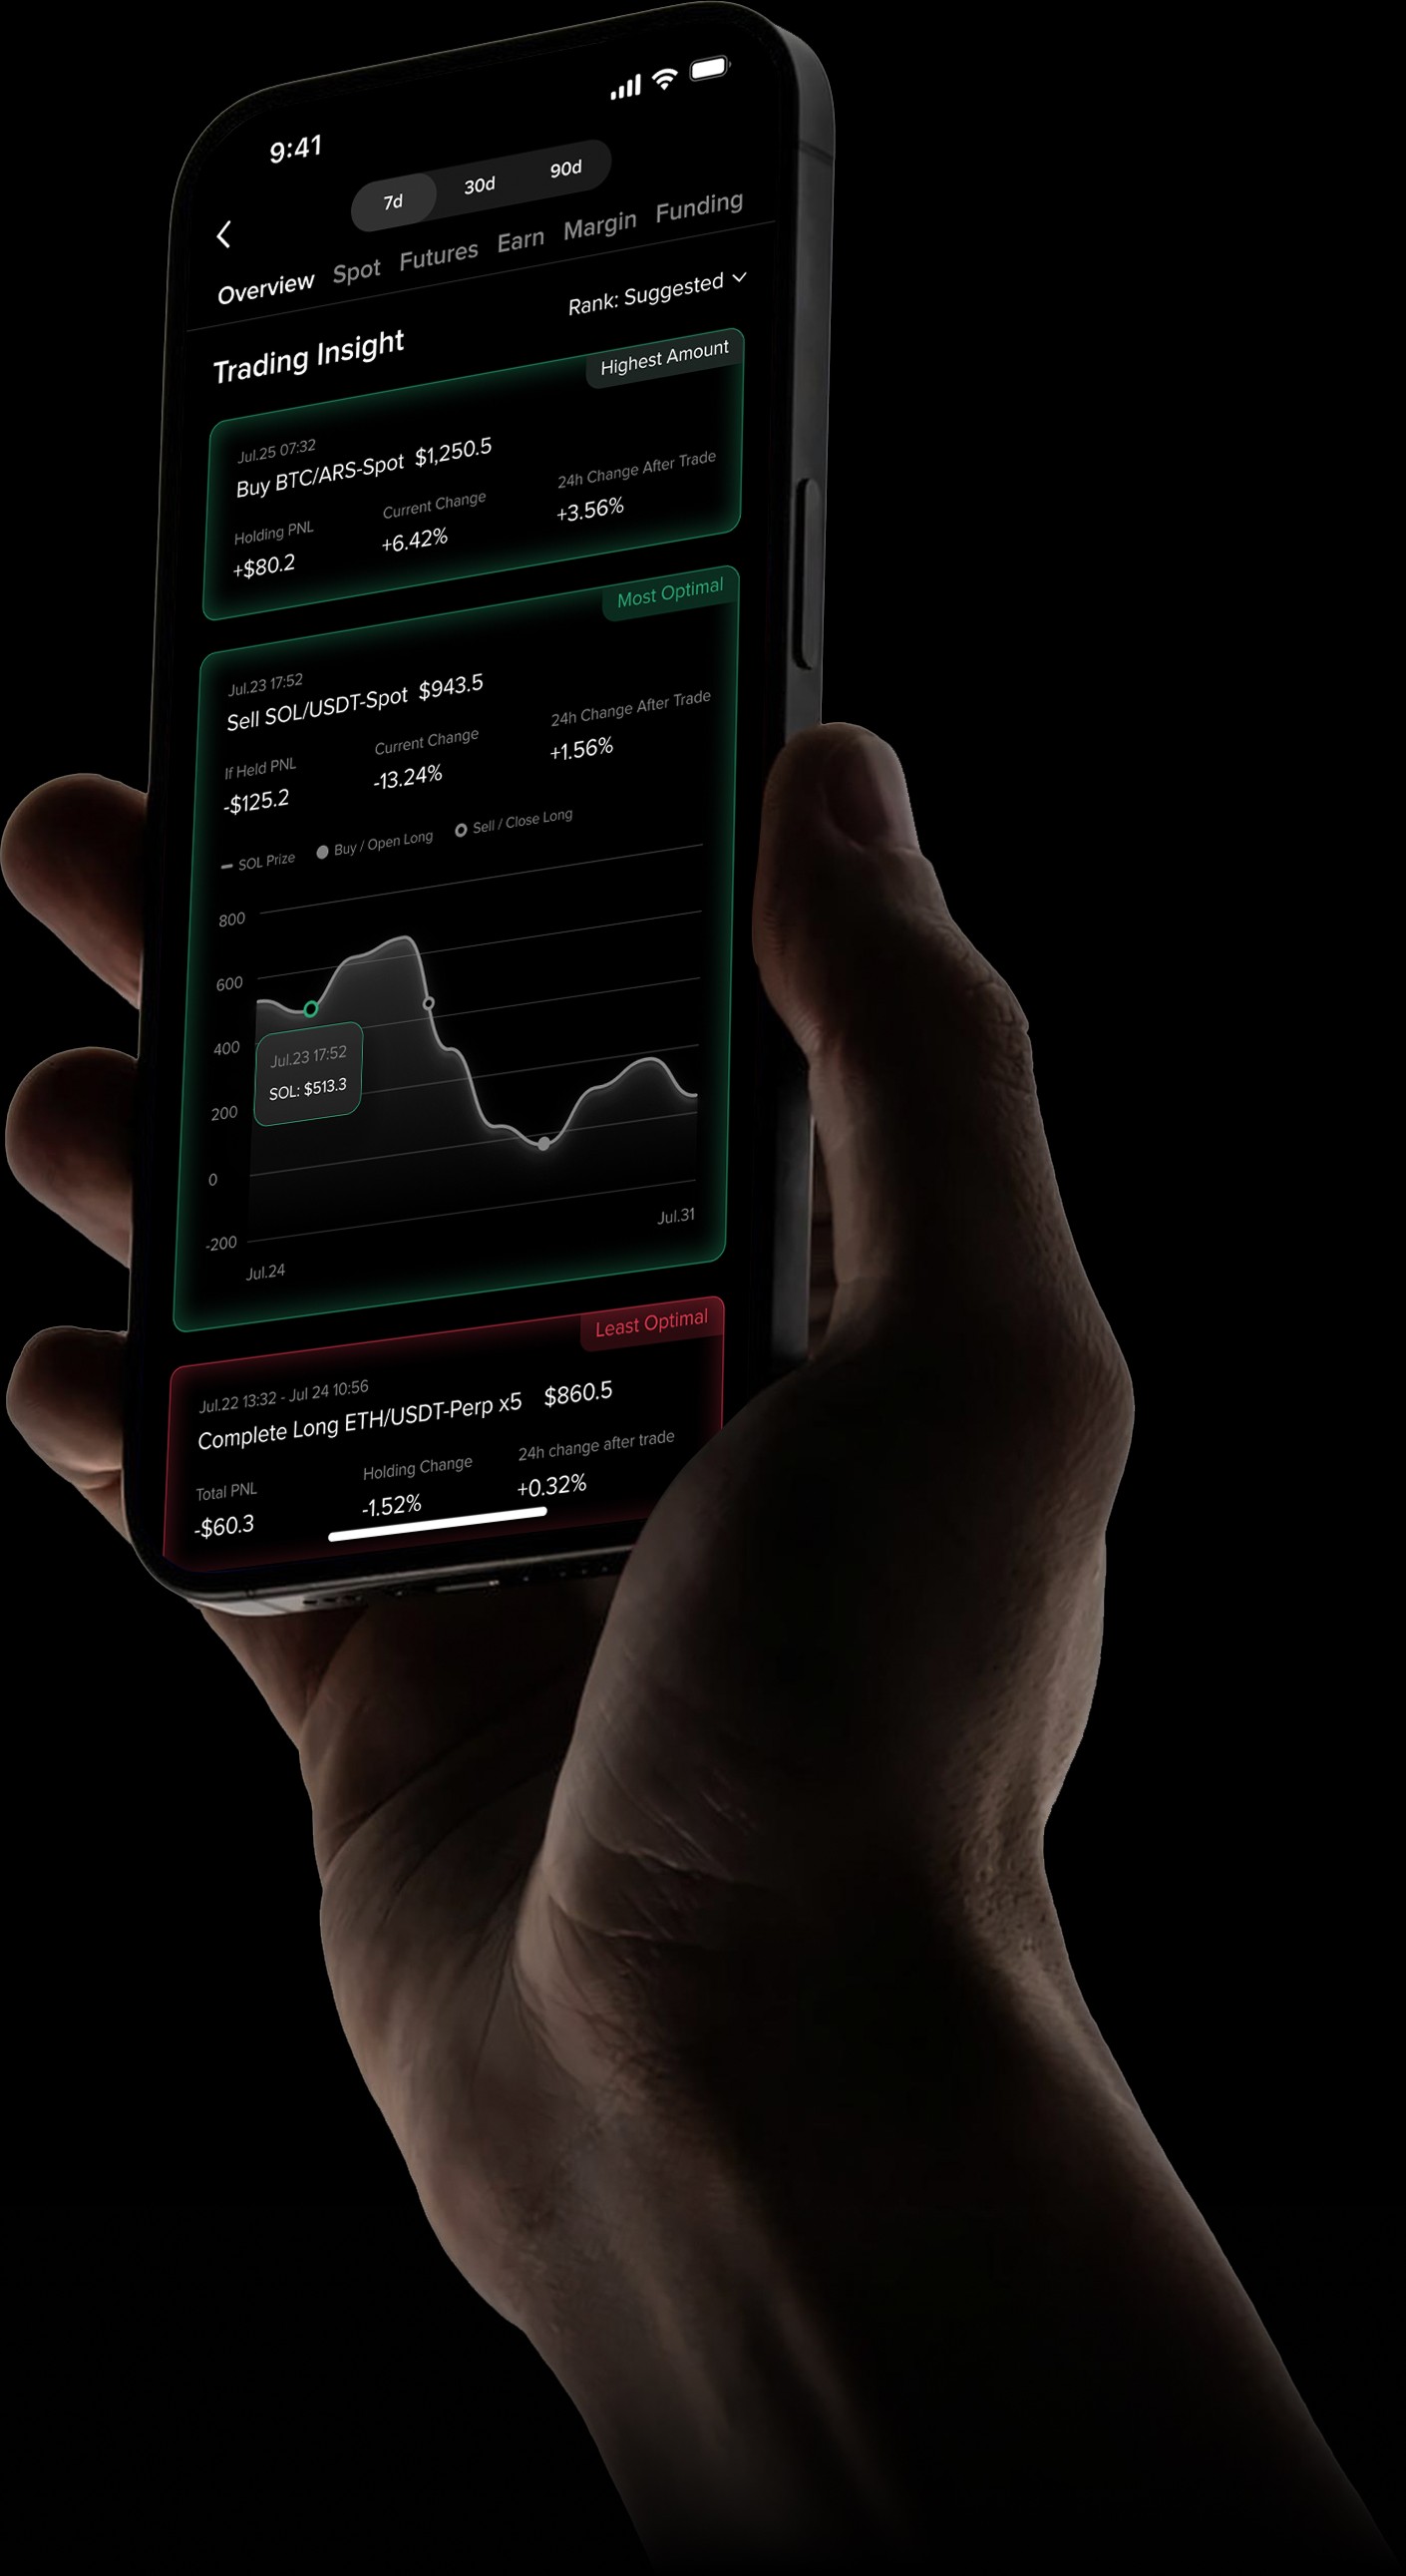
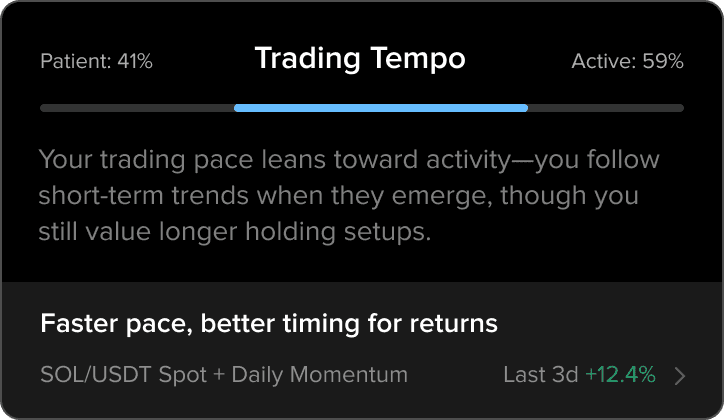
Trading Insight
Highlights key behaviors by highest volume, highest gain, and highest loss
Crypto / Account Allocation
Supports switching between crypto and account views for distribution
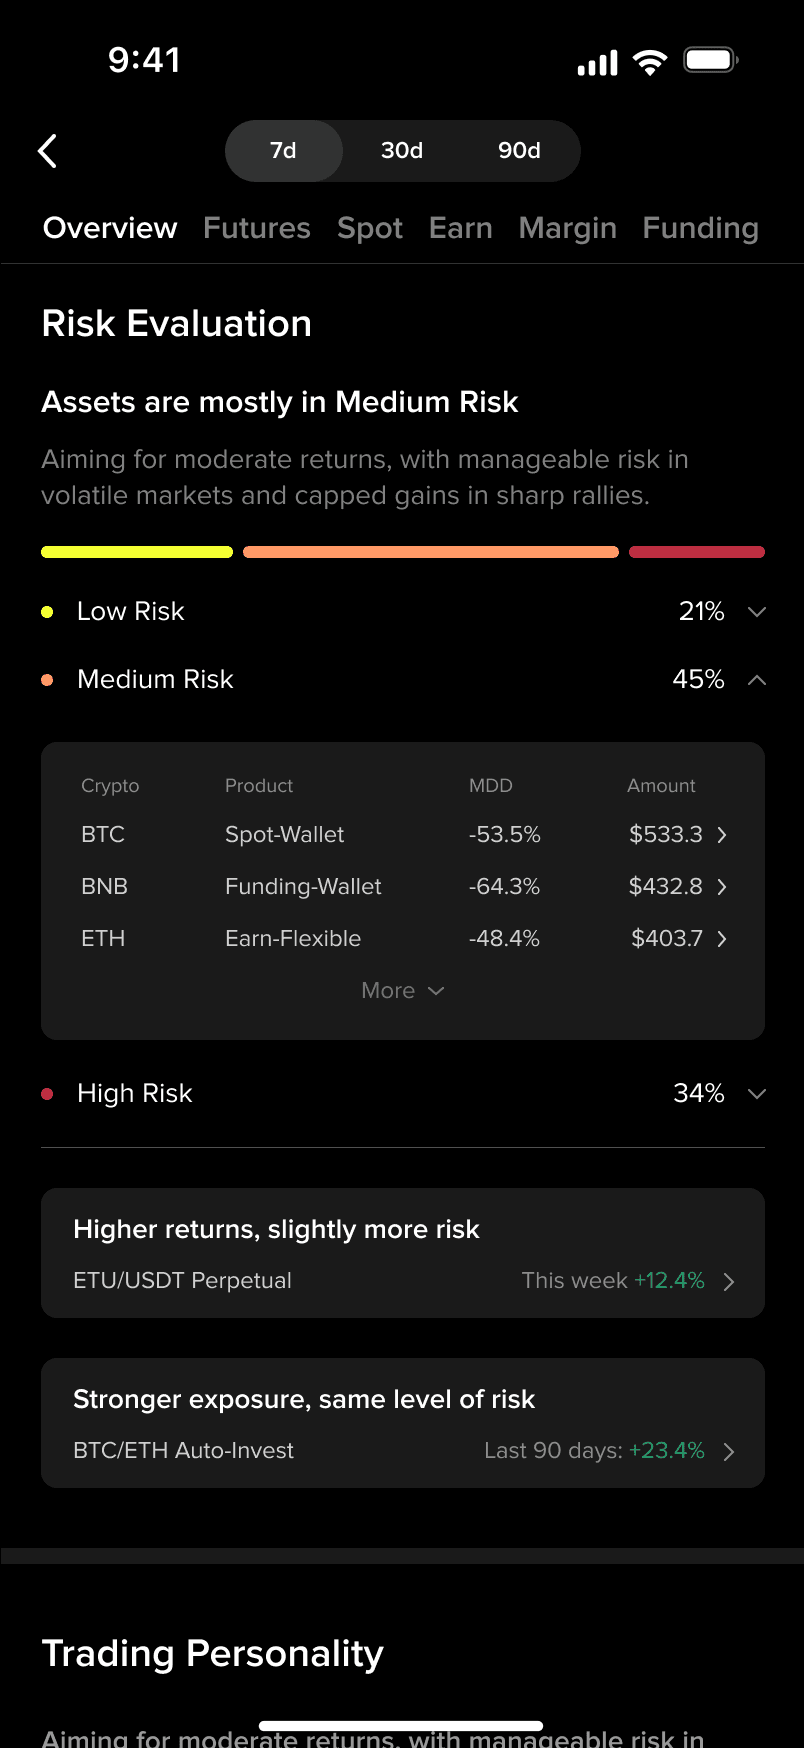
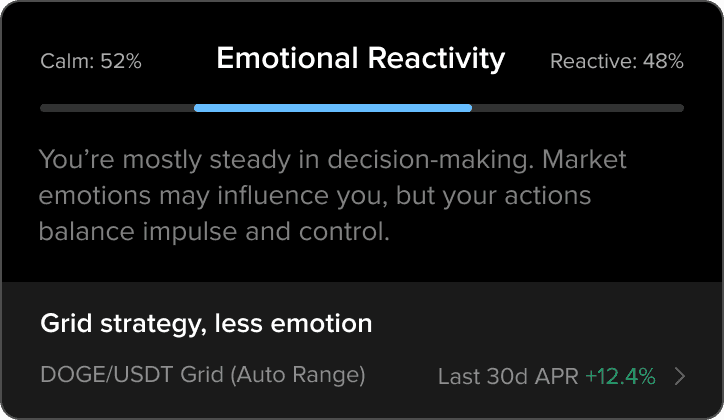
Risk Analysis
View detailed risk data by crypto/account, with suggestions by risk level
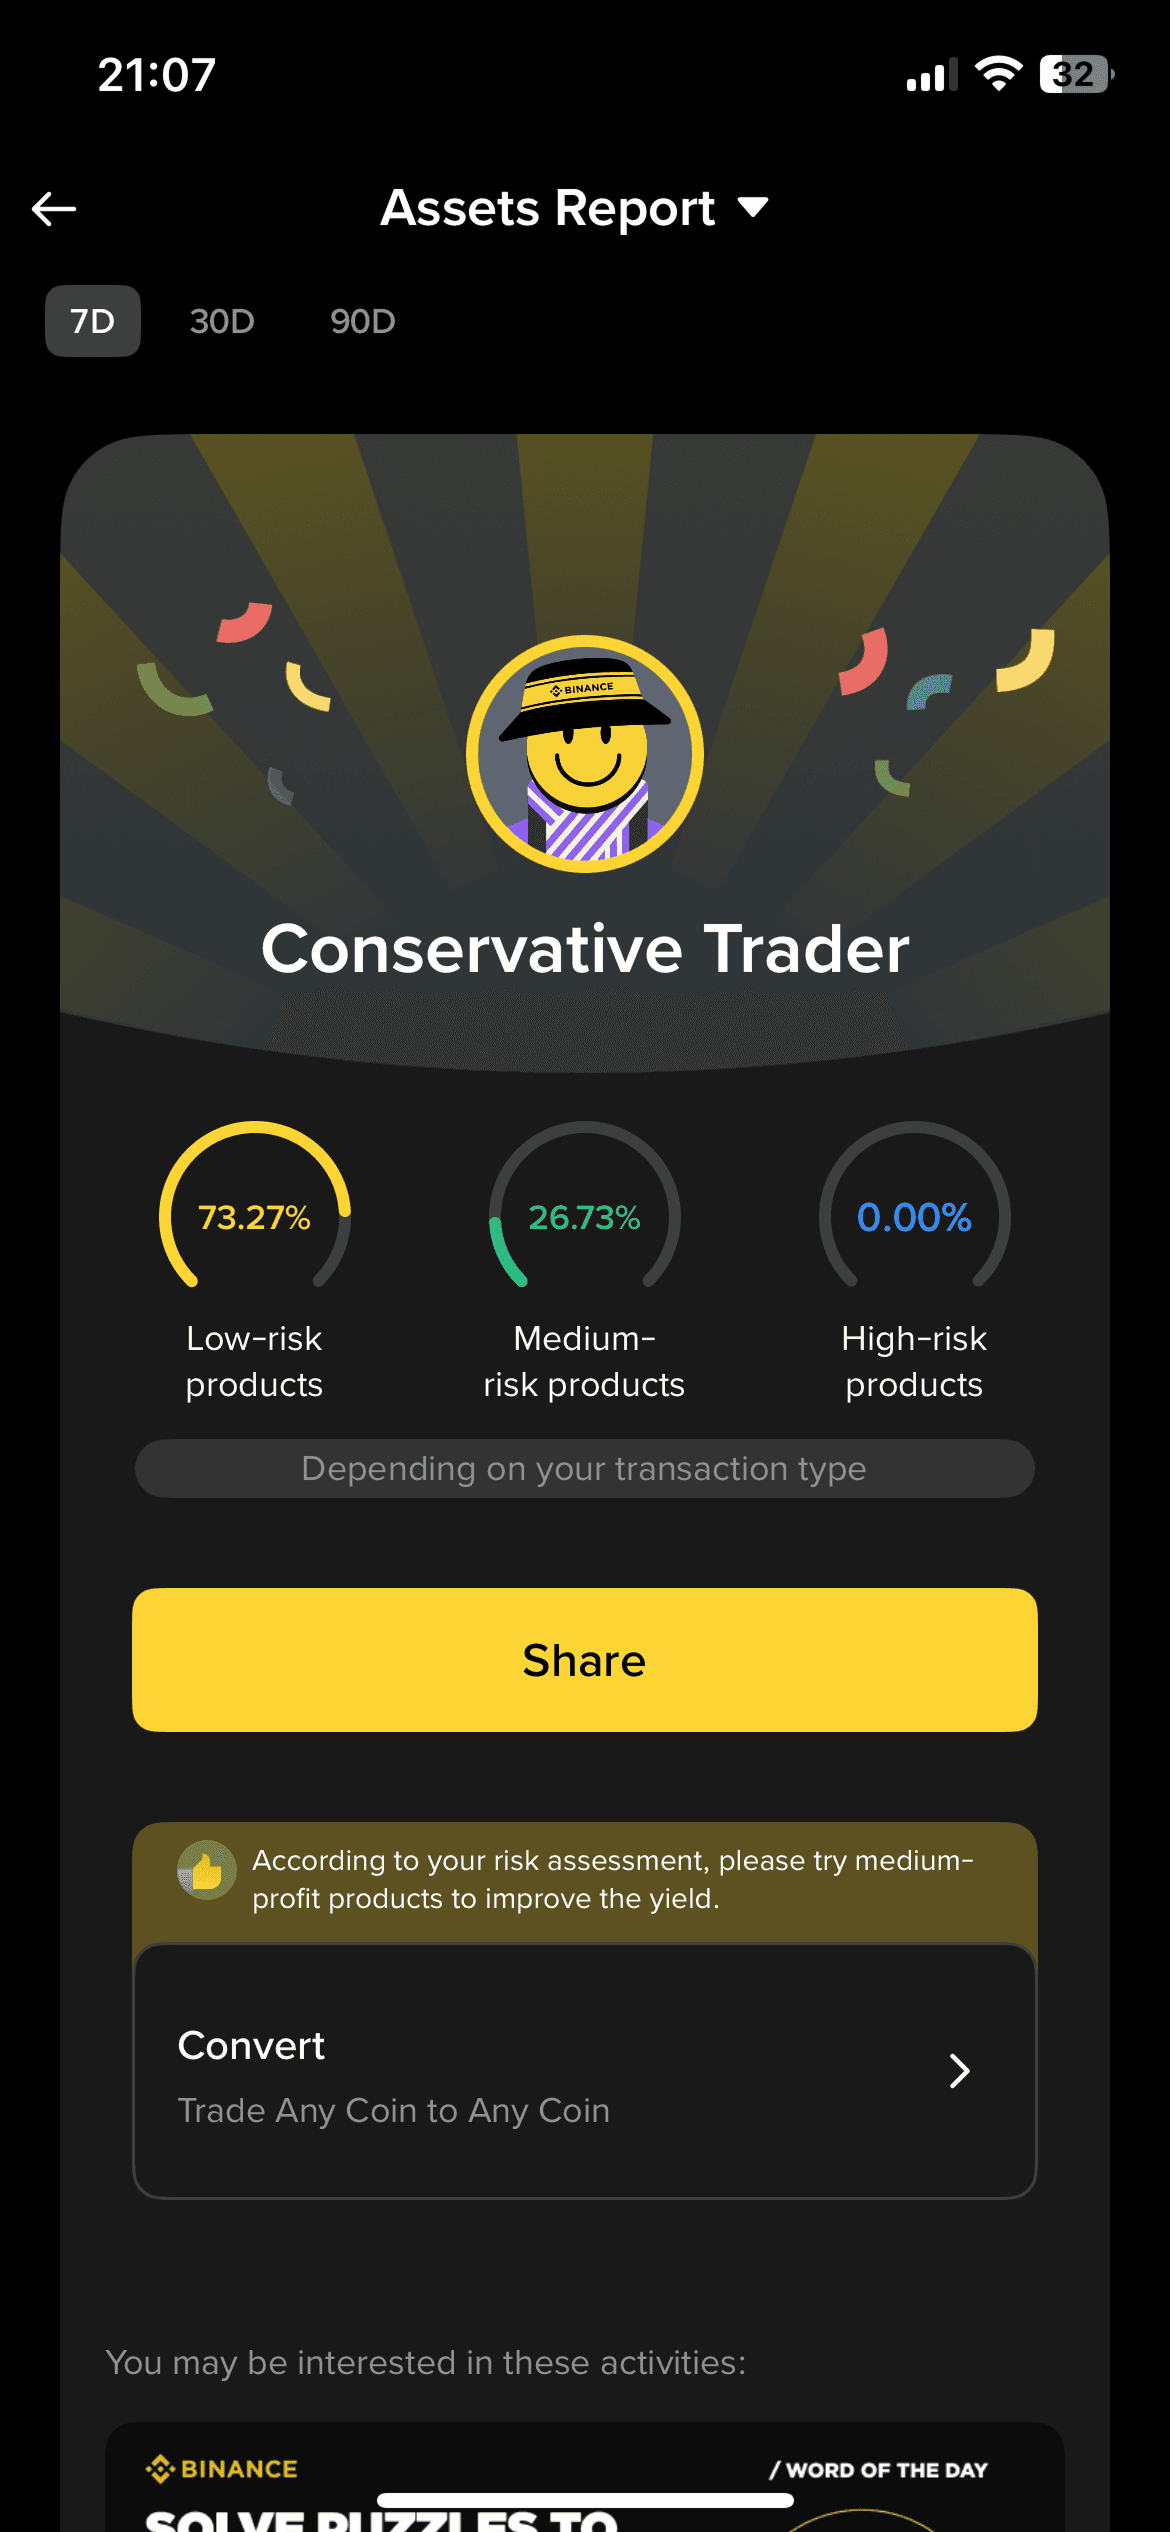
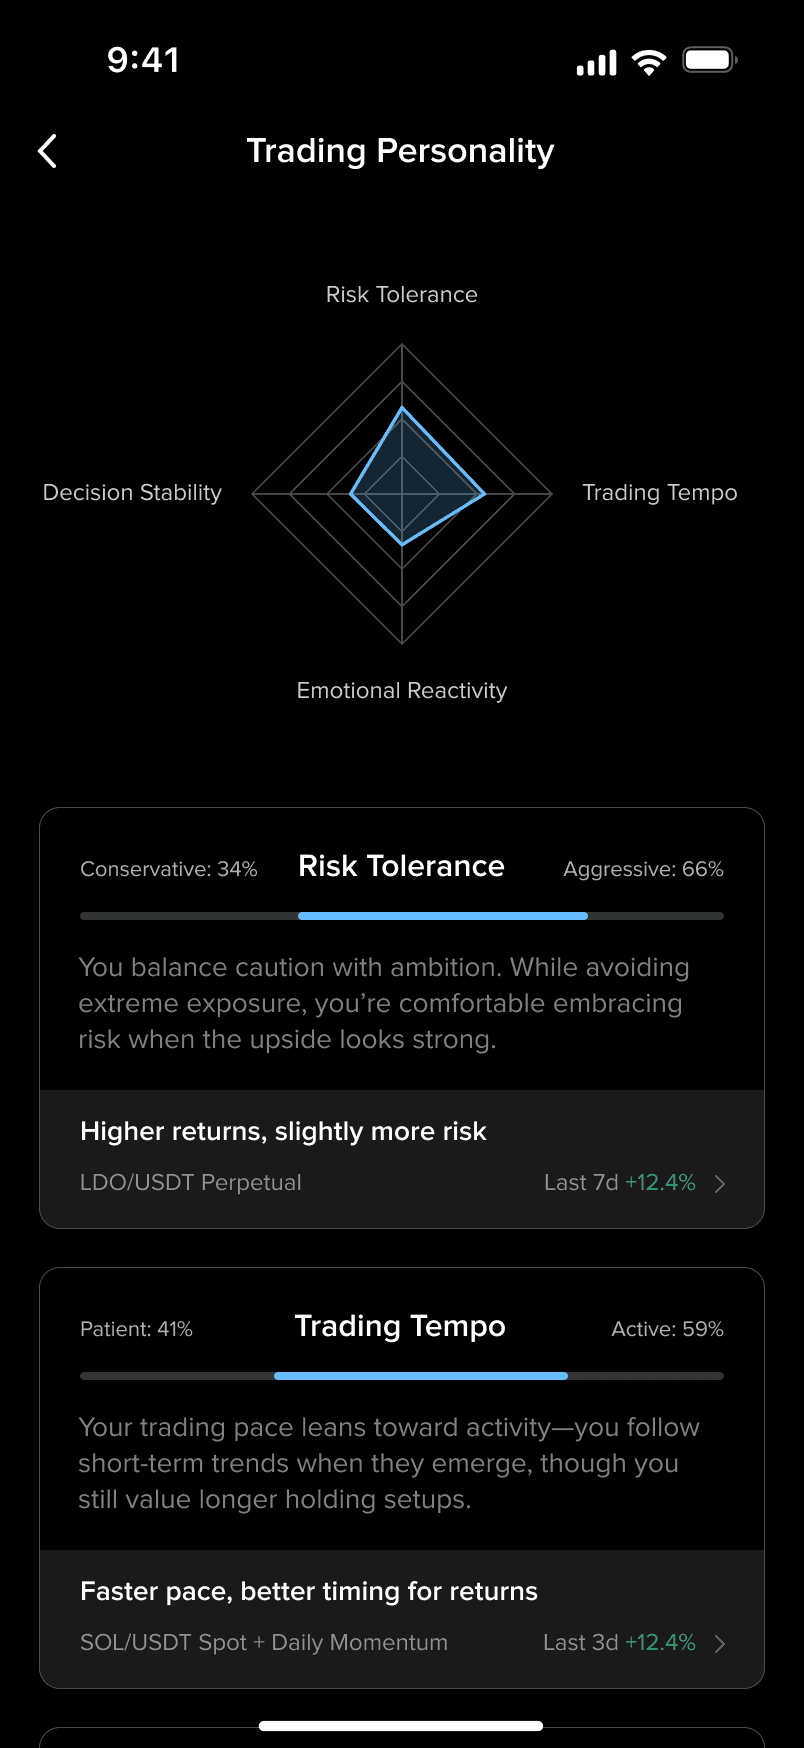
Trading Personality
Profiles trading behavior in four dimensions to give more accurate product recommendations
A more comprehensive
PNL overview
After
Before
Tapping on today’s PNL while led to an asset trend chart cause misunderstanding, asset chart included transfer between chain therefore may not reflect actual earning
A line chart is unsuitable for independent daily PNL. The trade PNL chart under the asset chart is composed of separate daily values, and showing it as a line rather than bars can mislead users into thinking it’s cumulative.
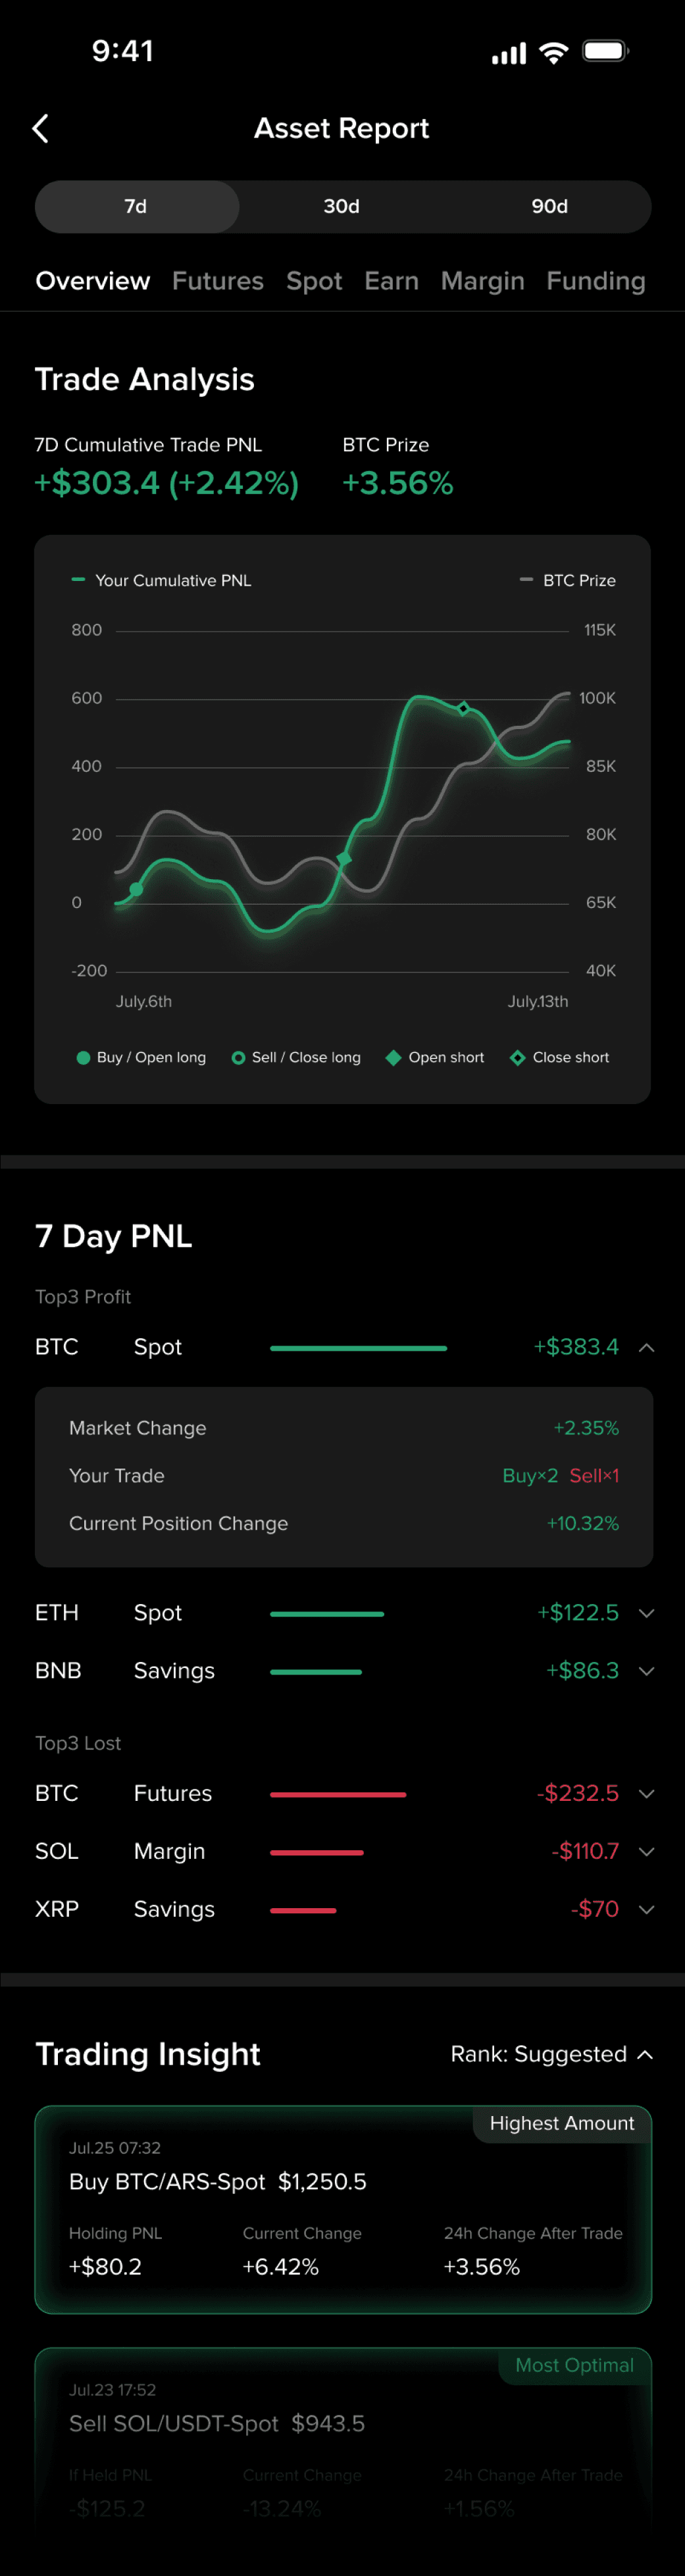
Start with cumulative PNL, BTC market trend and recent trading activity, providing a clear snapshot of overall performance.
Provide cumulative PNL instead of asset trend to match the context of tapping on profit.
Display BTC market trend to help compare personal returns with overall movement.
Display recent trading activity to attribute returns and briefly review actions in the context of market trends.
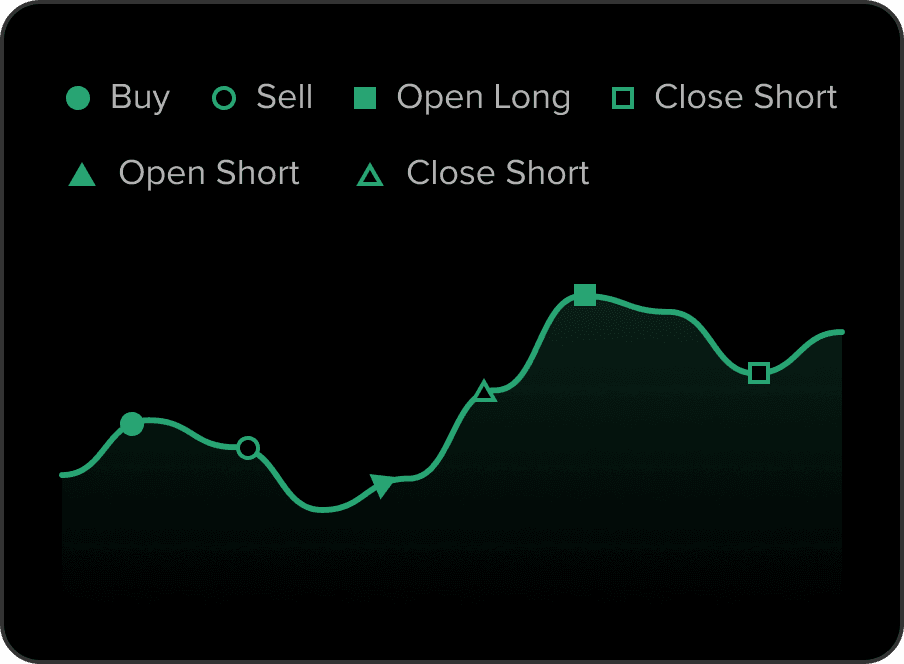
Using multiple colors on red and green curves reduced clarity.
Using shapes reduced color clutter, but six types were still too complex.
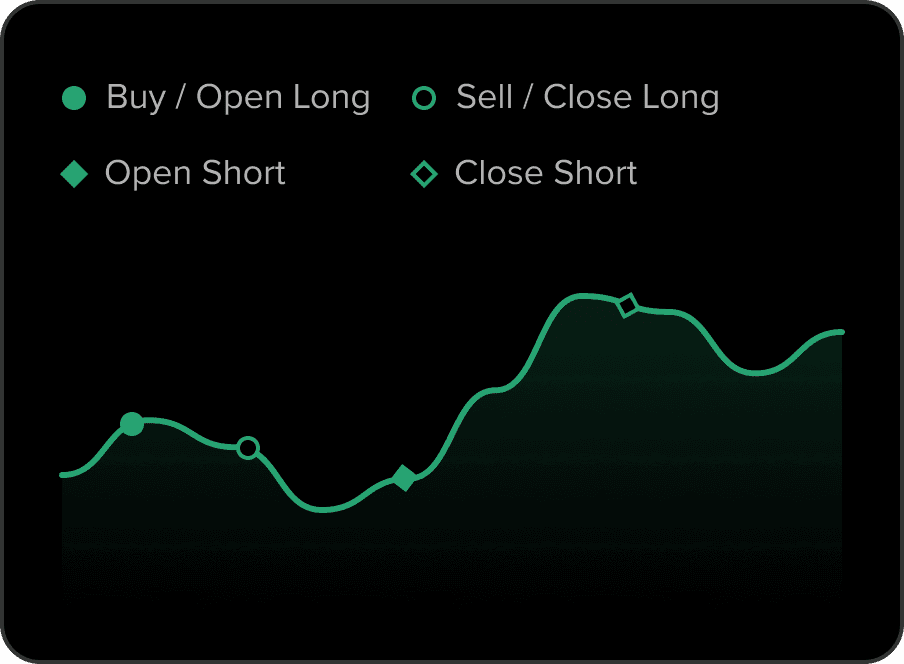
Simplified legend
for better chart reading
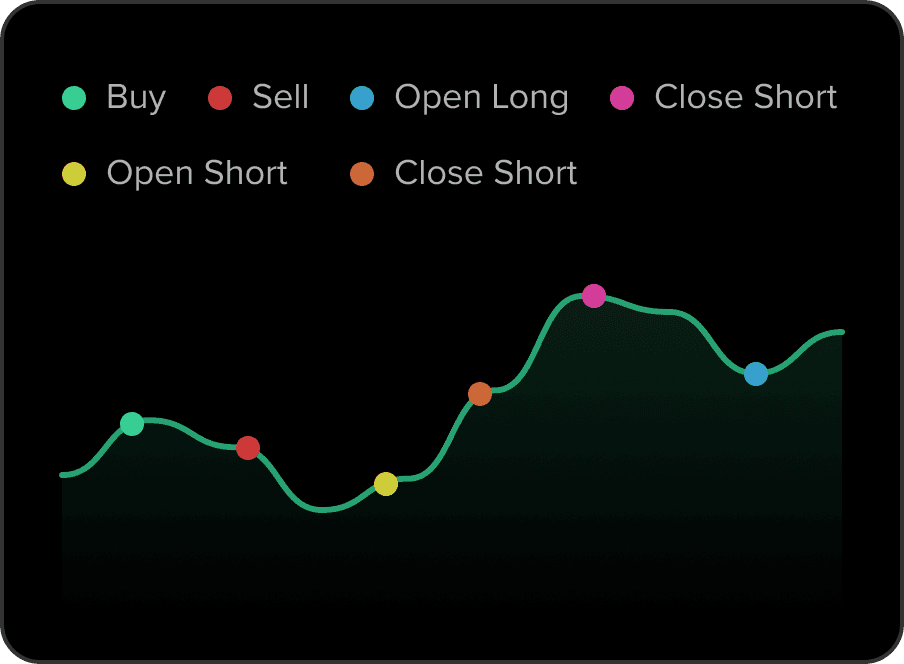
Grouping similar actions into four symbols made the chart cleaner and easier to follow
Every gain and loss
Clearly tied to
Coin–product pairs


P&L is shown only by account or only by coin, scattered across the page, making attribution difficult.
Within a single account or a single coin, multiple trades may exist with vastly different outcomes, making it hard to identify which account–coin combinations are driving overall P&L.
By crypto–product pairs, the top 3 gains and losses are displayed for clear attribution.
Before
After
Tap to expand for attribution analysis. View market trends, trades, and position changes to distinguish market-driven from behavior-driven results.
Unified PNL axis for intuitive comparison. Bars use a single scale, with red and green indicating direction.
From static records
To insightful trade review
Three-dimension view
For behavioral insight.
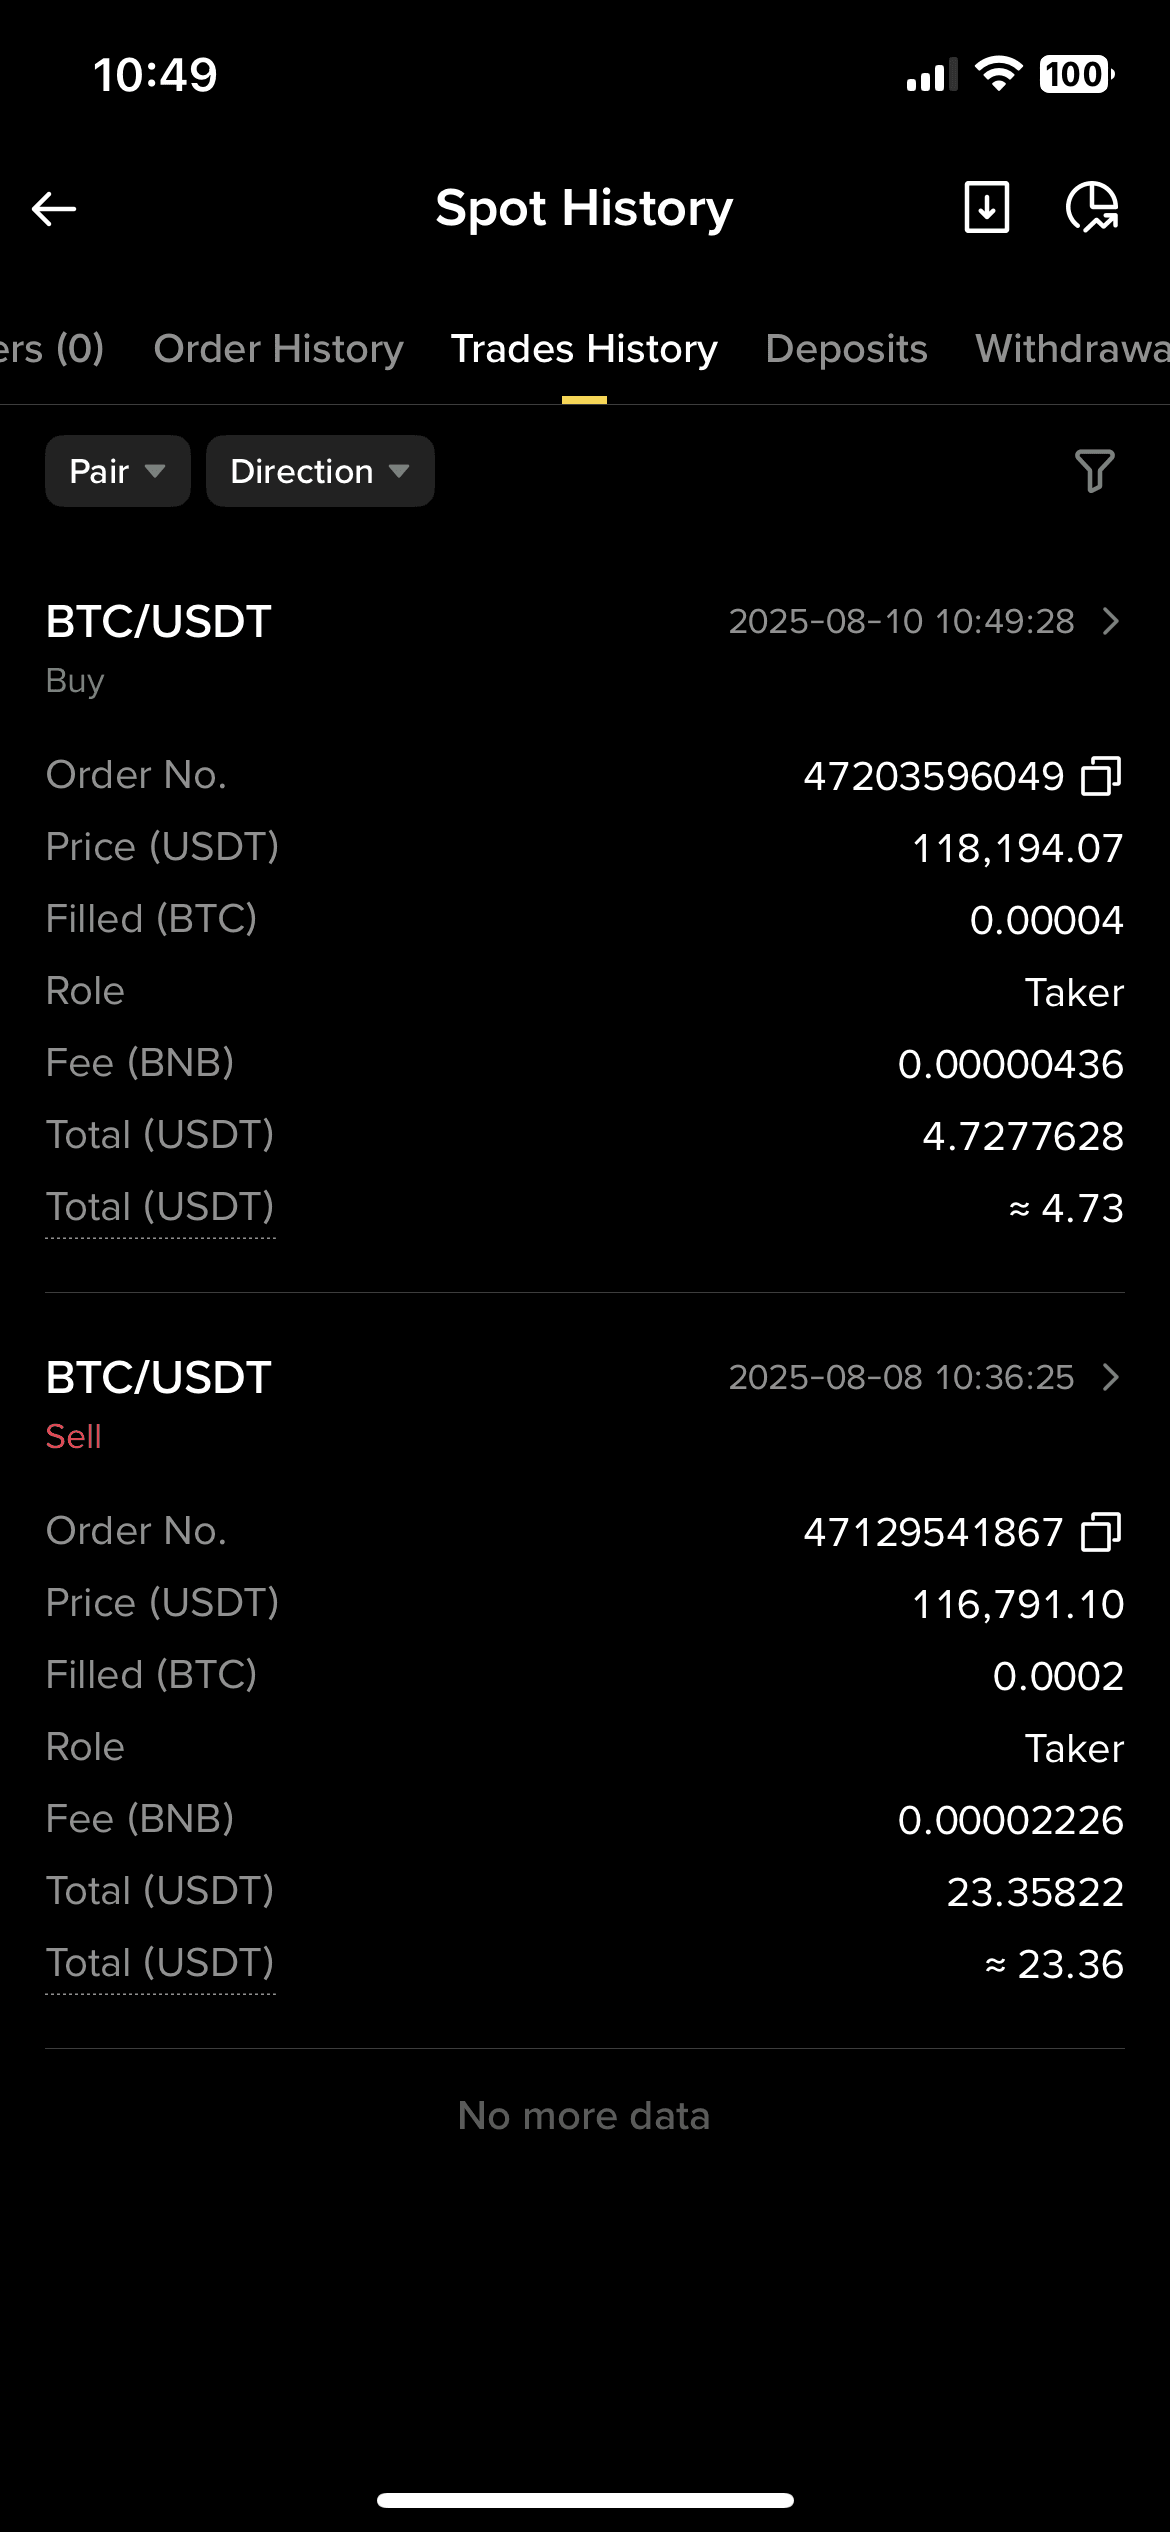
Static trade history
Built for search not review.
Three metrics and charts help evaluate trade quality and timing
Review actions
Not just held assets
Use colors to mark outcomes
Instead of price changes
Sell trades include hypothetical holding P&L to evaluate exit timing. This shows potential results if the asset had been kept, helping measure the quality of the decision.
Traditional red and green for price changes is not always intuitive. For example, selling or shorting in a falling market is favorable, yet red may cause misunderstanding.
From the perspective of the user, colors now indicate favorable or unfavorable outcomes rather than price changes, removing ambiguity and makes results easy to read at a glance.
Completed trades display P&L and price changes during the trade period. This reveals how market movement influenced the outcome.

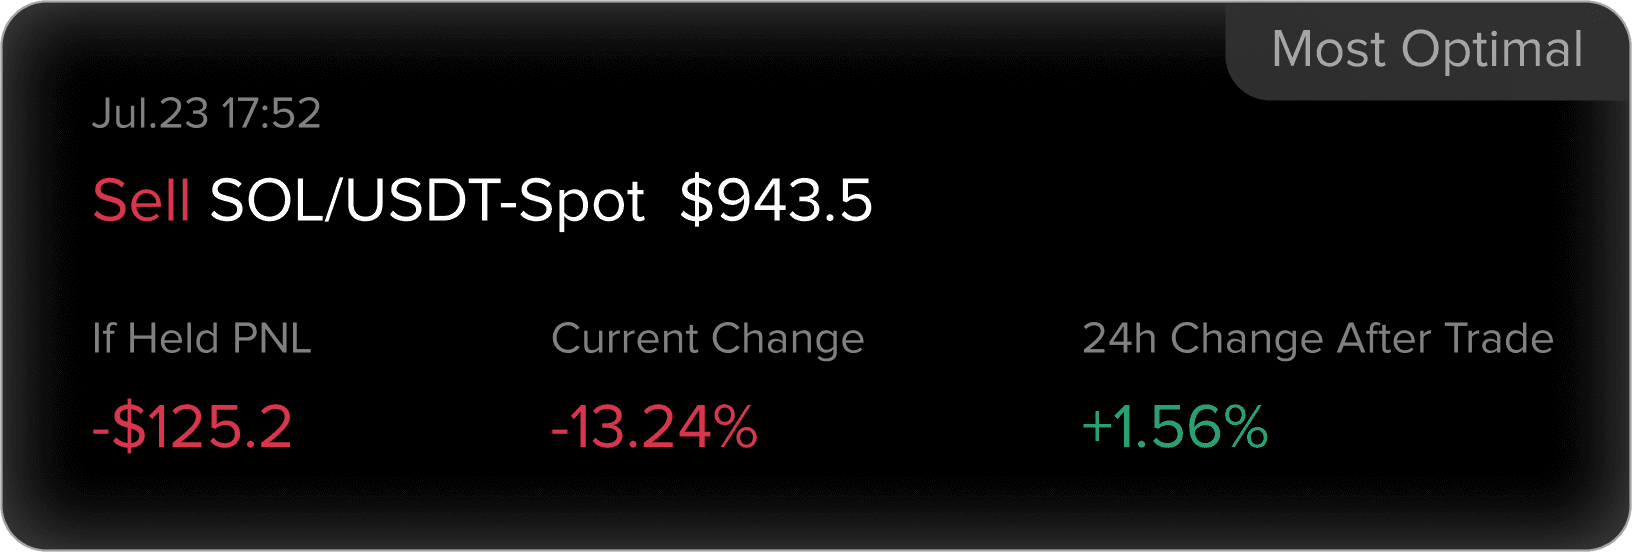
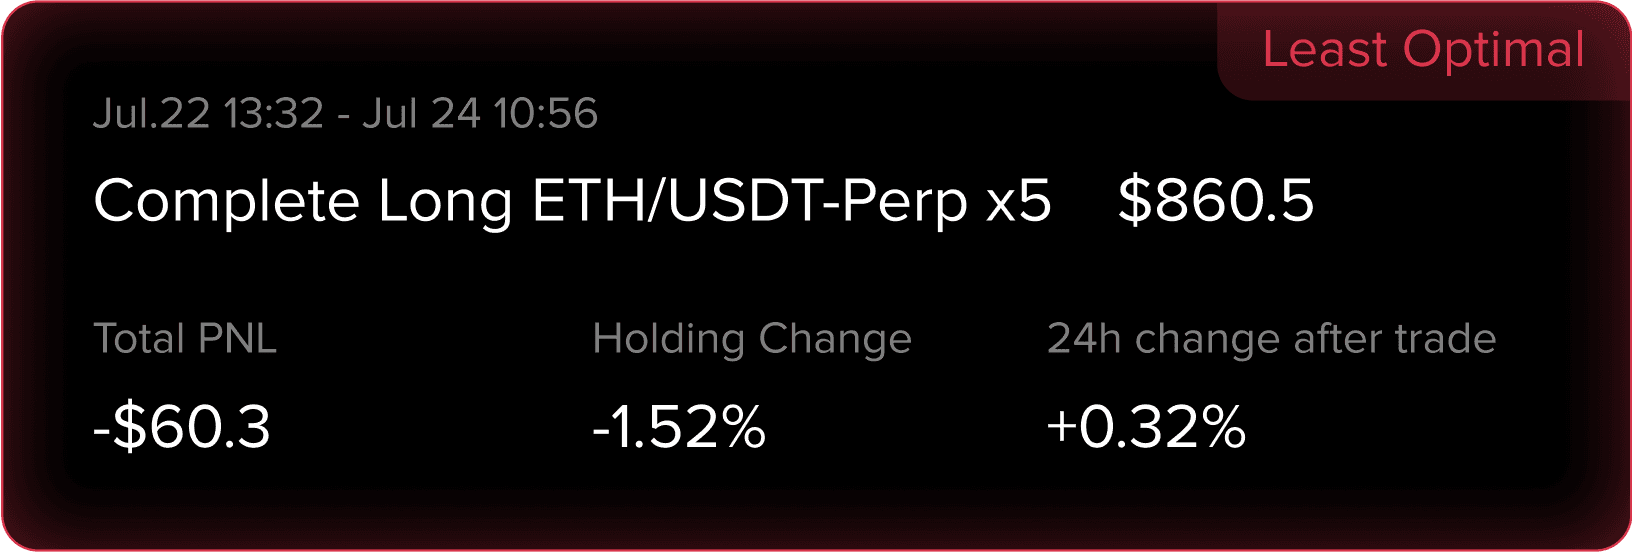
Highlights the most representative trades—largest amount, most optimal, and least optimal, allowing quick review and easy switching between perspectives.
P&L, price change, and 24h post trade change combine long and short term views, with expandable charts to review timing against market trends.
A full, detailed list is effective for finding specific transactions but offers little support for identifying patterns or evaluating trade quality.

Interactive risk analysis
For precise adjustments
Before
After
Only shows overall risk proportions, leaving users unable to break down risks in detail or adjust positions accordingly.
Risk levels can be expanded into a crypto–product view, allowing users to see details and make precise adjustments.
Recommendations are aligned to the surrounding context, and a two-stage presentation makes them easier to accept.
Product suggested abruptly, lacking contextual relevance and situational alignment.
More
Personalized
Suggestion

From generic promotions
To psychology-driven insights
Recommendations are disconnected from user behavior, with product promotions inserted directly into key data sections. This interrupts the reading flow and reduces trust in the suggestions
Before
After
A subtle way
To deliver the targeted advice
Report page footer
Complements the PNL report
Assets page pull-down
Quick access without interrupting the main content
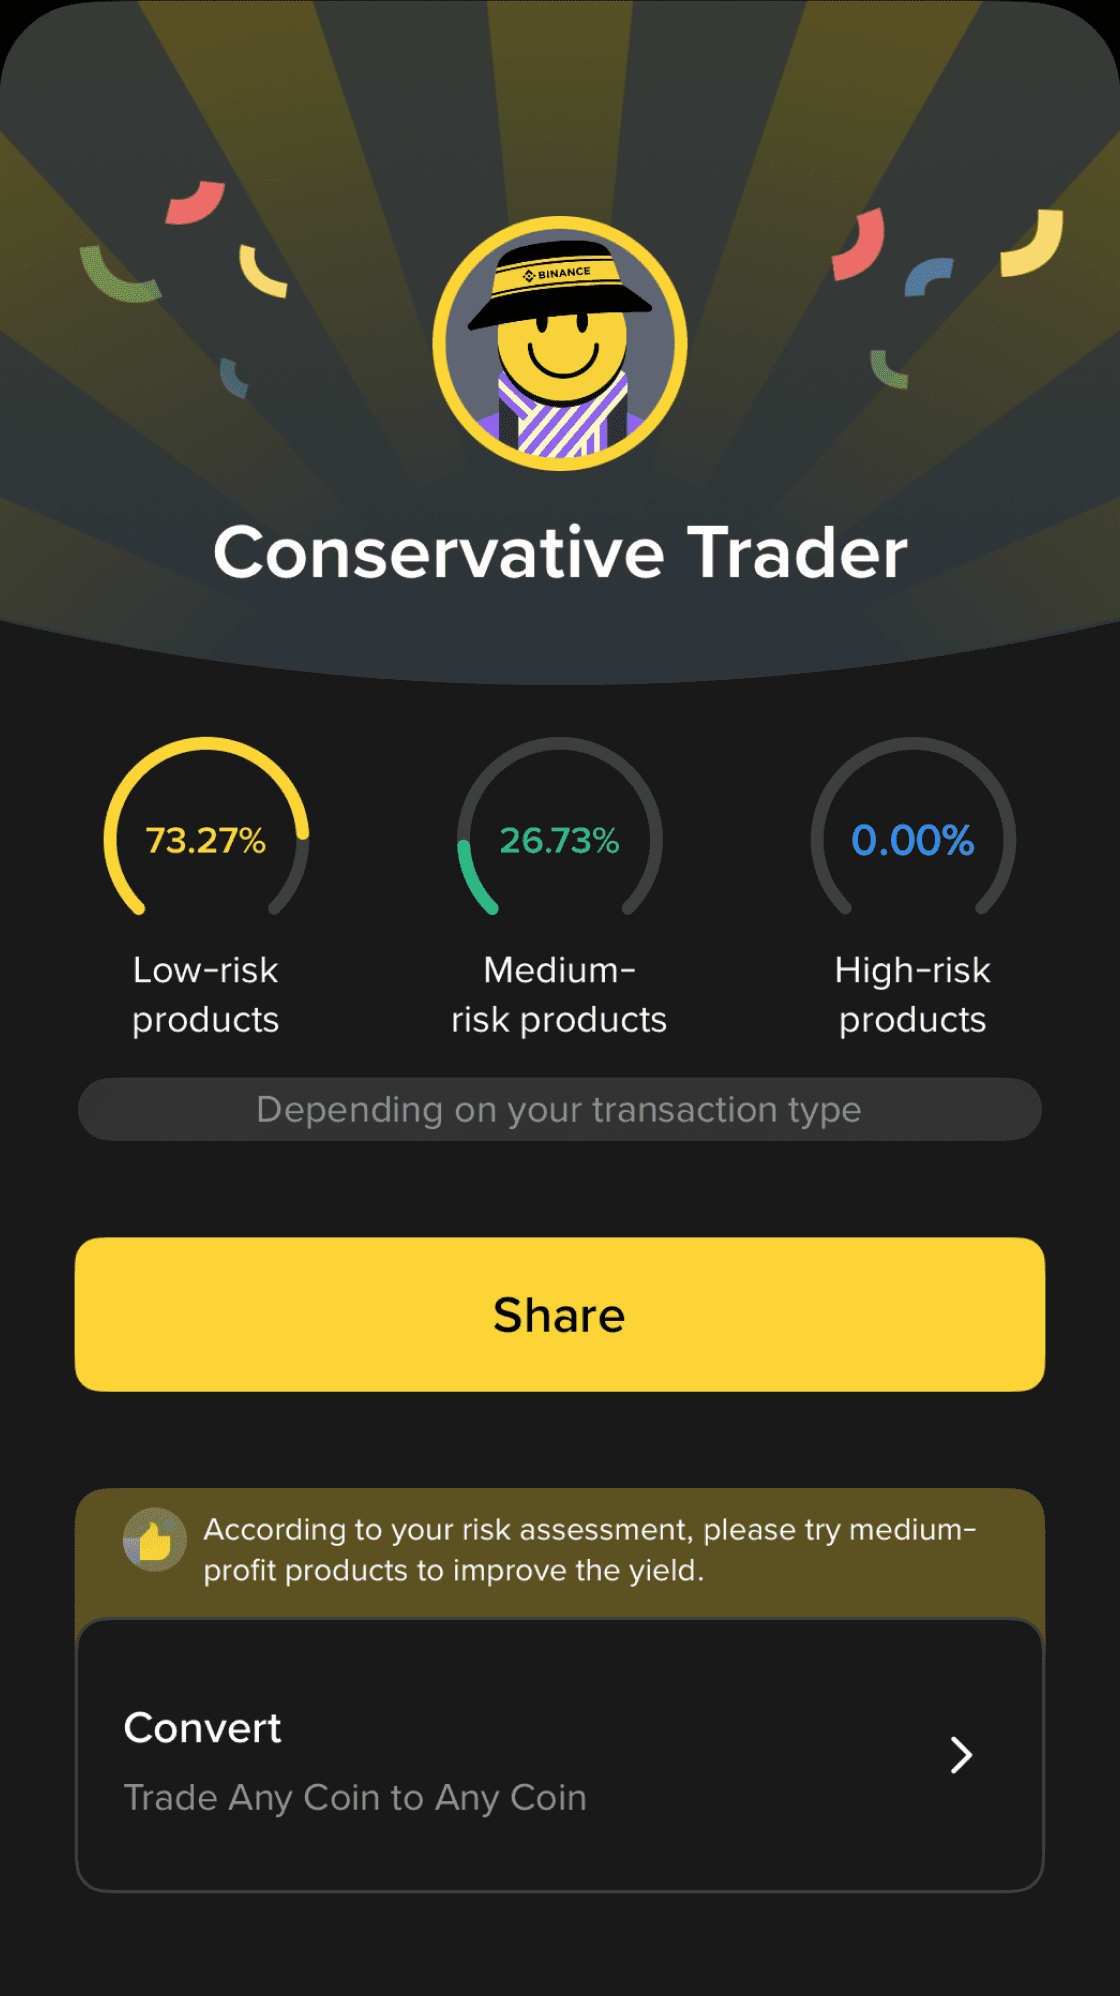
Applying psychology
To trading behavior model
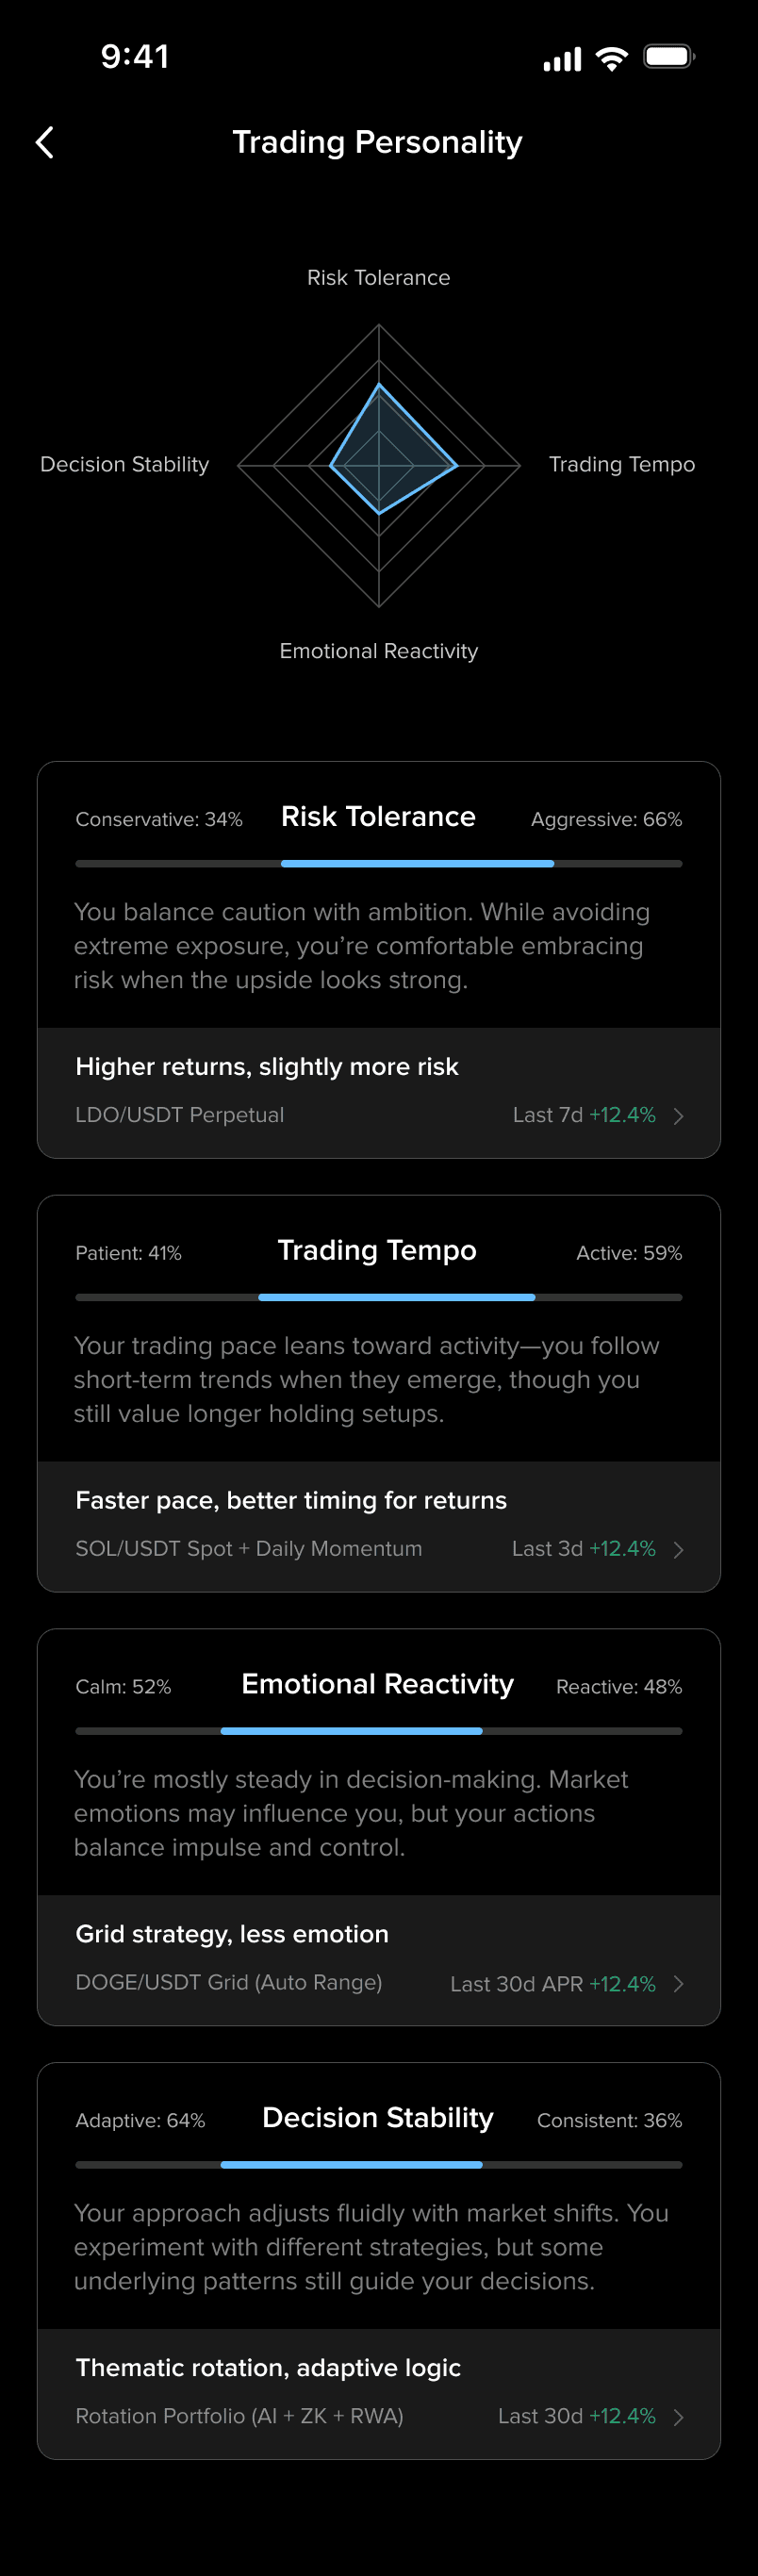
Four dimensions to profile user behavior, Profiles trading behavior across risk tolerance, trading tempo, emotional reactivity, and decision stability. Each dimension is independent but together they form a complete trading personality.
Balanced, Objective, and Personalized

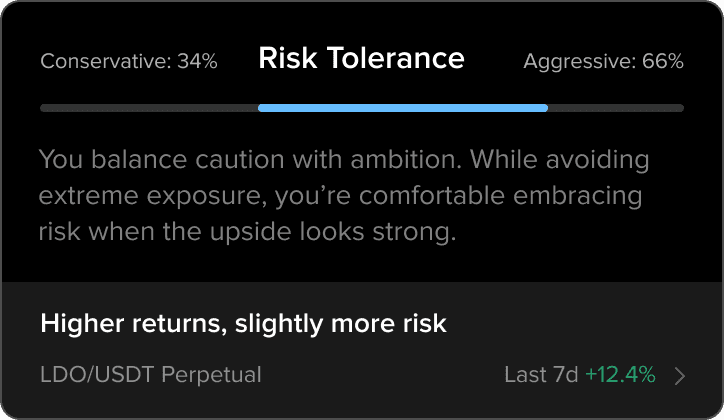
Neutral presentation
Show percentages on both ends to highlight tendencies without binary labels, reflecting a full spectrum of traits.
Personalized recommendations
Suggest products based on specific behaviors, matching user habits for higher relevance.
Objective description
Link trading behavior to actual actions in a neutral tone, avoiding value judgments.